
WTI Crude Oil Technical Analysis and Short-Term Forecast
WTI crude oil broke higher out of an intra-day coil pattern (dark blue dotted lines) and settled the day above the $38.1 smaller than (0.618) target of the primary wave up from $36.13 (red). The $38.1 level was also the midpoint of the September 8 candlestick. This was positive for the near-term outlook and calls for a test of $39.0 tomorrow. However, $39.0 will likely hold.
The $39.0 objective is extremely important for the near-term outlook because it is the equal to (1.00) target of the primary wave up from $36.13 (red) and the 38 percent retracement of the decline from $43.78 (pink). Settling above this would warn that the recent move down might already be complete and would call for a test of $40.0 and higher.
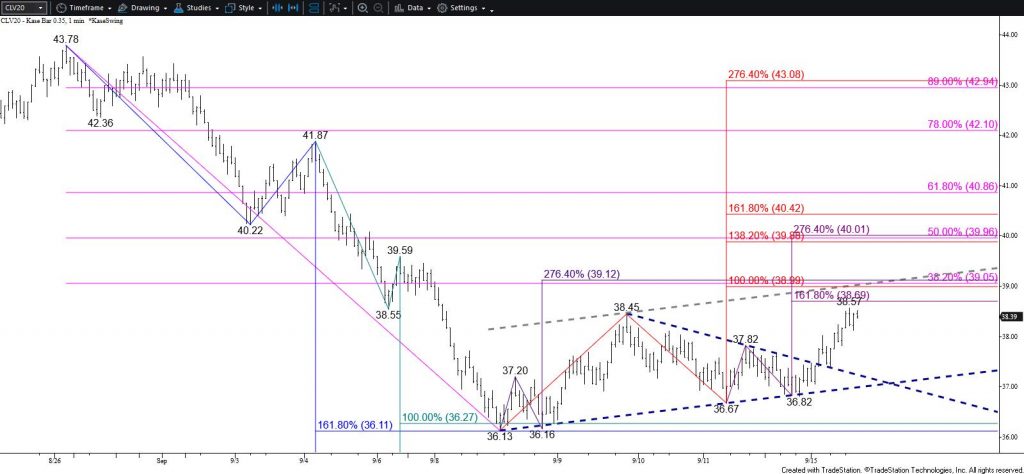
Nevertheless, aside from today’s move up, the rise from $36.13 has been extremely shallow and choppy. Therefore, this move is most likely corrective. Additionally, the move up from $36.13 could form a bearish flag pattern if $39.0 holds. This is because a trend line parallel to the lower trend line of the coil (gray dotted line) will intersect with $39.0 tomorrow.
Once $39.0 is met, odds for a test of $37.6 will increase. Holding $39.0 and settling below $37.6 will confirm that a flag is forming and will call for a test of $37.1. This is currently the 62 percent retracement of the rise from $36.13 and is in line with the potential flag’s lower trend line. Settling below $37.1 will call for another test of $36.0.
Granted, $36.0 was and still is, major support for the longer-term outlook. Therefore, the move down might be complete. However, the fate of WTI’s near-term outlook will be determined by holding or closing above $39.0 tomorrow.
Brent Crude Oil Technical Analysis and Short-Term Forecast
Brent formed a double bottom around $39.3 that will be confirmed by a close above the $41.20 swing high. The target of the double bottom is $43.1. Based on the waves up from $39.30, Brent should rise to $41.3 tomorrow. However, an immediate close above this (and the $41.20 swing high) will likely be a challenge because $41.3 is the 100-day moving average.
Once $41.3 is met, odds for a test of $39.9 will rise. Settling below $39.9 would imply that a rectangle pattern is forming instead of a double bottom. This pattern would be bearish for the outlook rather than bullish. In this case, odds would shift in favor of testing $39.3, a close below which would call for the move down from $46.61 to continue.
This is a brief analysis for the next day or so. Our weekly Crude Oil Forecast and daily updates are much more detailed and thorough energy price forecasts that cover WTI, Brent, RBOB Gasoline, Diesel, and spreads. If you are interested in learning more, please sign up for a complimentary four-week trial.