WTI Crude Oil Technical Analysis and Short-Term Forecast
This is a brief analysis for the next day or so. Our weekly Crude Oil Forecast and daily updates are much more detailed and thorough energy price forecasts that cover WTI, Brent, RBOB Gasoline, Diesel, and spreads. If you are interested in learning more, please sign up for a complimentary four-week trial.
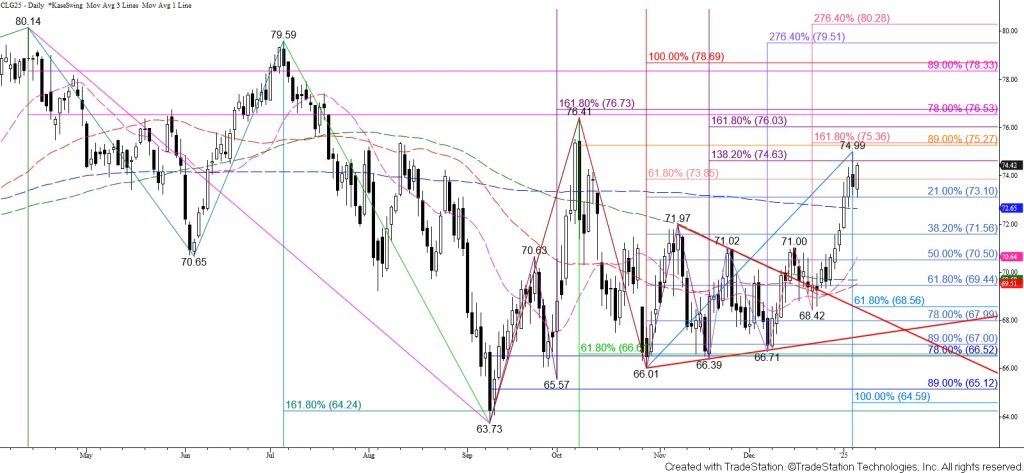
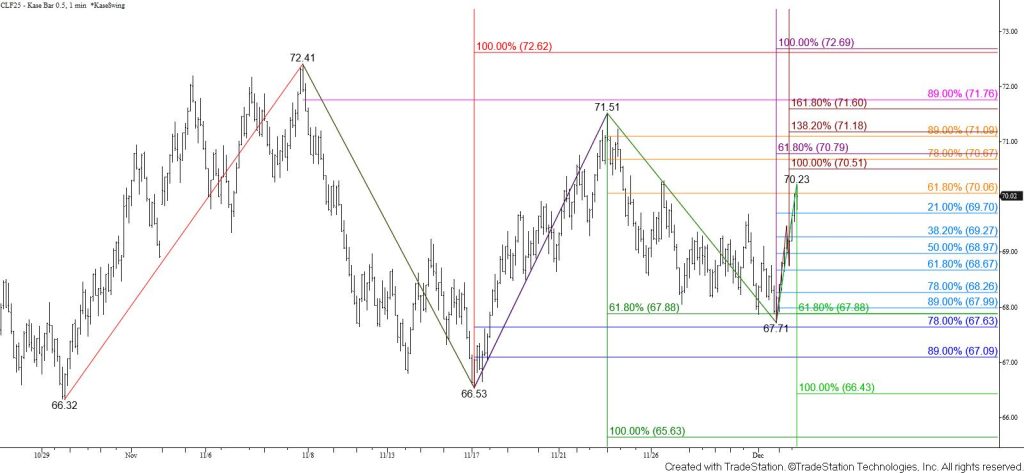
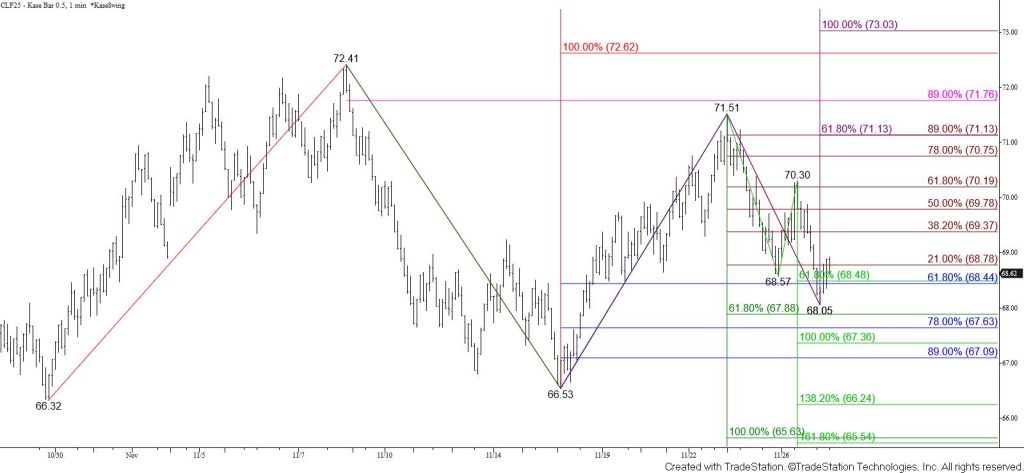
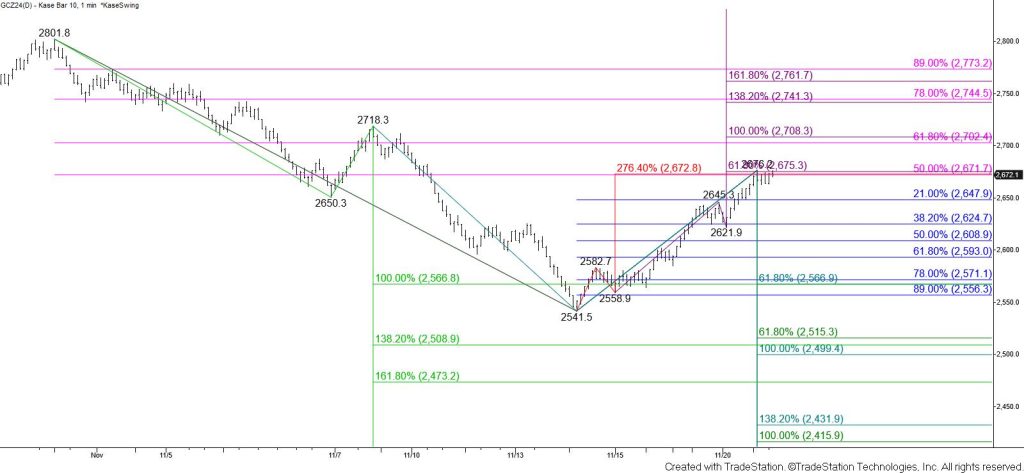
WTI crude oil has developed a bullish outlook in recent weeks. Last week’s close above the $63.9 smaller than (0.618) target of the primary wave up from $63.73 implies that prices should eventually reach this wave’s $78.7 equal to (1.00) target.
For the near term, WTI crude oil shook off Monday’s pullback. Support at $73.0, near the 21 percent retracement of the rise from $66.01, held and prices settled just below the 62 percent retracement of the decline from $74.99. Today’s rise has put WTI crude oil in a position to challenge $74.8 again. Settling above this will take out the intermediate (1.382) target of the wave up from $66.01. This will clear the way for a test of $75.4 and then the respective $76.0 and $76.7 larger than (1.618) target of the wave up from $66.01 and the first wave up from $63.73.
Nevertheless, there is still a modest chance for a deeper test of support soon given the daily KasePO and Slow Stochastic are overbought. Should the move up stall again and close below the $73.4 smaller than target of the wave down from $74.99 look for a test of the equal to (1.00) target and 200-day moving average at $72.7. Settling below $72.7 will shift the near-term odds in favor of testing the 38 percent retracement of the rise from $66.01 at $71.6 before the move up extends.