Natural Gas Technical Analysis and Near-Term Outlook
This is a brief analysis for the next day or so. Our weekly Natural Gas Commentary and daily updates are much more detailed and thorough energy price forecasts that cover key natural gas futures contracts, calendar spreads, the UNG ETF, and several electricity contracts. If you are interested in learning more, please sign up for a complimentary four-week trial.
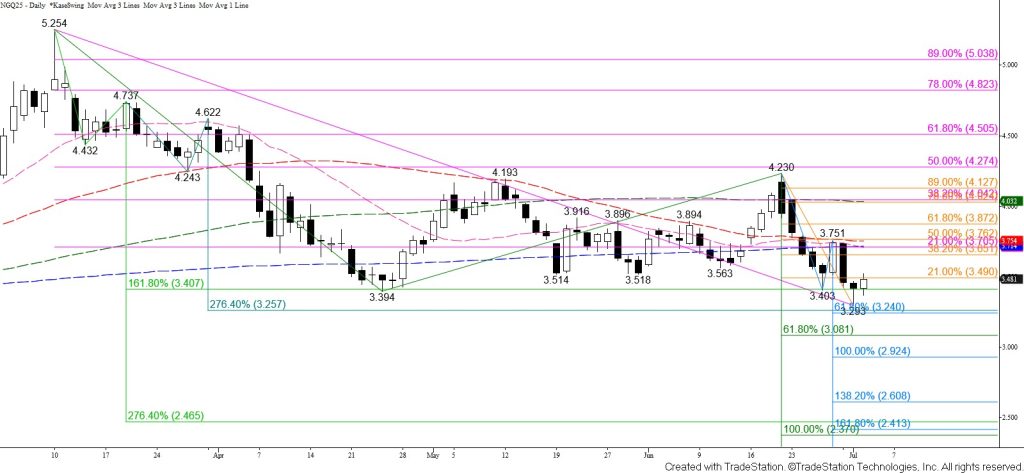
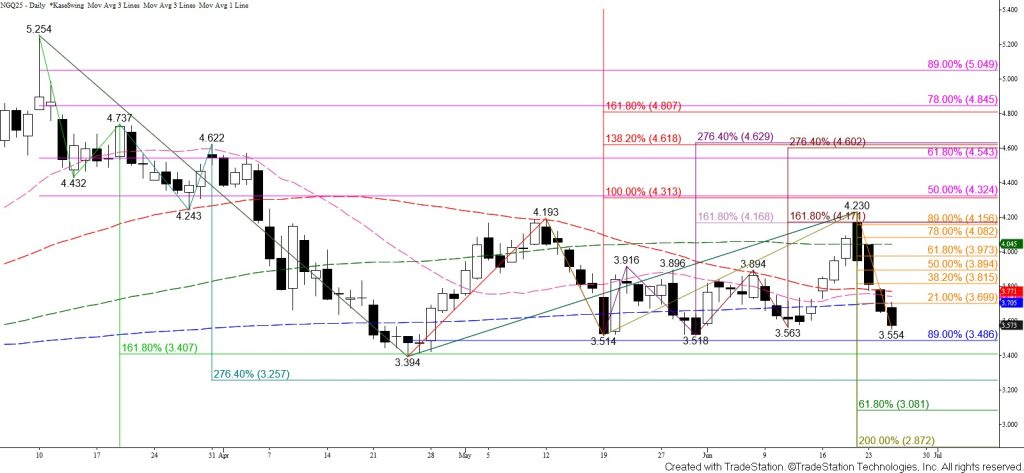
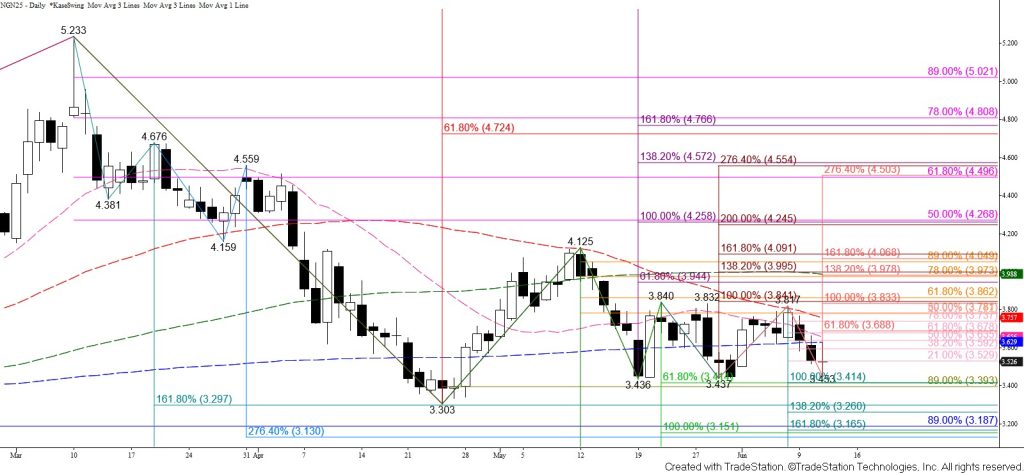
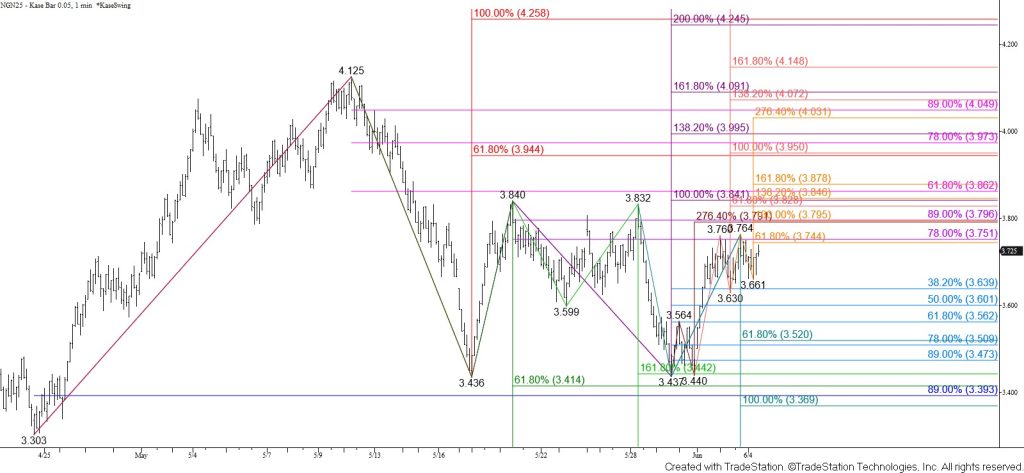
August natural gas broke through major support at $3.39 on Tuesday, but failed to close below that level. A daily hammer formed, and prices rose to test and hold the 21 percent retracement of the decline from $4.230 on Wednesday. Daily bullish MACD, RSI, and Stochastic divergences were also confirmed on Wednesday.
The outlook leans bearish, and closing below $3.39 will open the way for a test of the $3.25 smaller than (0.618) target of the wave down from $4.230. This wave connects to $2.92 as the equal to (1.00) target. Therefore, settling below $3.25 would call for a test of a longer-term bearish decision point at $3.08. This is the smaller than target of the wave down from $5.254 and connects to $2.39 as the equal to target.
Nevertheless, this is a tight call for the next few days. The failure to close below $3.39, the formation of a daily hammer, and the confirmation of daily bullish momentum oscillator divergences indicate that a reversal might occur. Prices will need to settle above $3.59 to complete the hammer and open the way for a test of the pattern’s $3.74 confirmation point. Settling above $3.74 would confirm a bullish reversal is underway.