LME Copper Technical Analysis and Near-Term Outlook
This is a brief analysis for the next day or so. Our weekly Metals Commentary and daily updates are detailed and thorough price forecasts that cover key COMEX precious metals futures contracts and LME Non-Ferrous (Base) metals, spot gold, the gold/silver ratio, and metals ETFs. If you are interested in learning more, please sign up for a complimentary four-week trial.
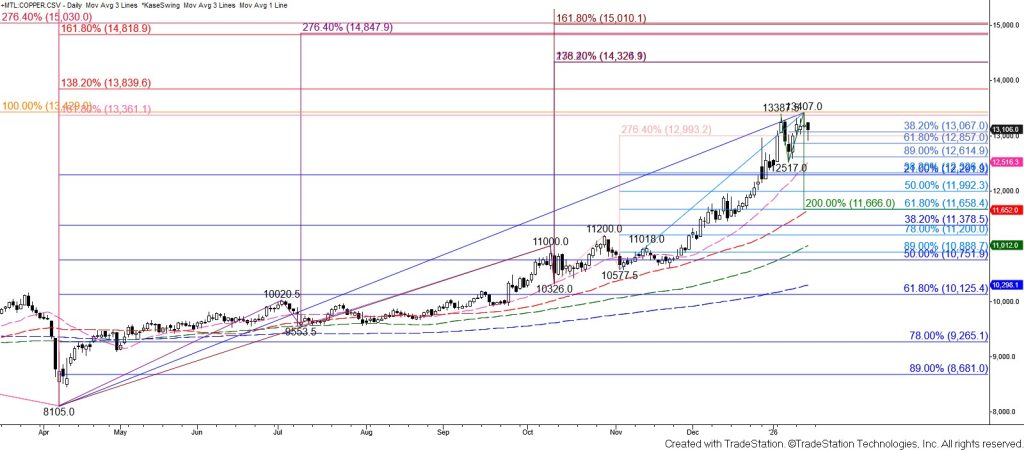
LME copper fell to test and hold the $12932 intermediate (1.382) target of the first wave down from $13407. Prices also held the 38 and 50 percent retracement levels of the rise from $12517 on a closing basis. However, there is a double top around $13400 and daily bearish KasePO, RSI, Stochastic, and MACD divergences, and a daily RSI overbought signal were confirmed today. Note that $13400 is an ideal stalling point because it is in line with the equal to (1.00) target of the wave up from $4371 and the larger than (1.618) target of the wave up from $7856.
These bearish factors indicate that a deeper correction will probably occur. Taking out $12864 will call for $12648, which then connects to the $12517 confirmation point of the double top. Settling below $12517 and confirming the double top would lead to a significant correction because the target of this reversal pattern is $11666, which is in line with the 62 percent retracement of the rise from $10577.5 and the 50-day moving average.
That said, this is a tight call for tomorrow because copper settled above the $13086 smaller than (0.618) target of the intraday wave up from $12915. This wave favors a test of its $13200 equal to (1.00) target, which is in line with the 62 percent retracement from $13407. Overcoming $13200 would call for another attempt to test and close above $13400. This would negate the double top and clear the way for $13712 and likely $13840 in the coming days.