WTI Crude Oil Technical Analysis and Short-Term Forecast
This is a brief analysis for the next day or so. Our weekly Crude Oil Forecast and daily updates are much more detailed and thorough energy price forecasts that cover WTI, Brent, RBOB Gasoline, Diesel, and spreads. If you are interested in learning more, please sign up for a complimentary four-week trial.
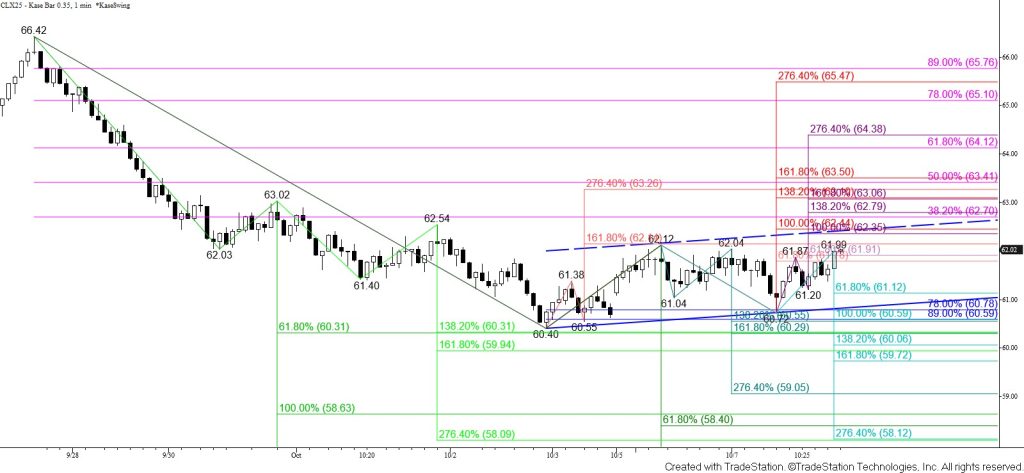
November WTI crude oil pulled back to test and hold the 78 percent retracement of the rise from $60.40 before rallying. Prices settled below the $61.8 confirmation point of Friday’s inverted hammer but overcame the smaller than (0.618) target of the new primary wave up from $60.40 and the sub-wave up from $60.72. The move up is likely a correction, but the inverted hammer, confirmed daily RSI and MACD divergences, and the wave formation up from $60.40 call for a test of at least $62.4. Overcoming $62.4 will call for a move above the 38 percent retracement from $66.42 at $62.7 to challenge a confluent $63.0 target and possibly higher in the coming days.
The move up from $60.40 has been relatively shallow compared to the decline from $66.42, and as stated, is likely a correction. Currently, taking out $61.1 would call for a test of $60.6, a close below which will strongly suggest that the correction is complete. However, WTI will likely have to take out $60.3, the most confluent threshold on the chart, and a projection of the waves down from $66.42, $63.02, and $62.12 to open the way for $60.0 and lower.
Also note that should $62.4 hold and prices begin to pull back again, a bearish flag will form. Therefore, breaking through $62.4 will be crucial in proving that the move up from $60.40 is more than a short-lived correction.