Brent Crude Oil Technical Analysis and Short-Term Forecast
This is a brief analysis for the next day or so. Our weekly Crude Oil Forecast and daily updates are much more detailed and thorough energy price forecasts that cover WTI, Brent, RBOB Gasoline, Diesel, and spreads. If you are interested in learning more, please sign up for a complimentary four-week trial.
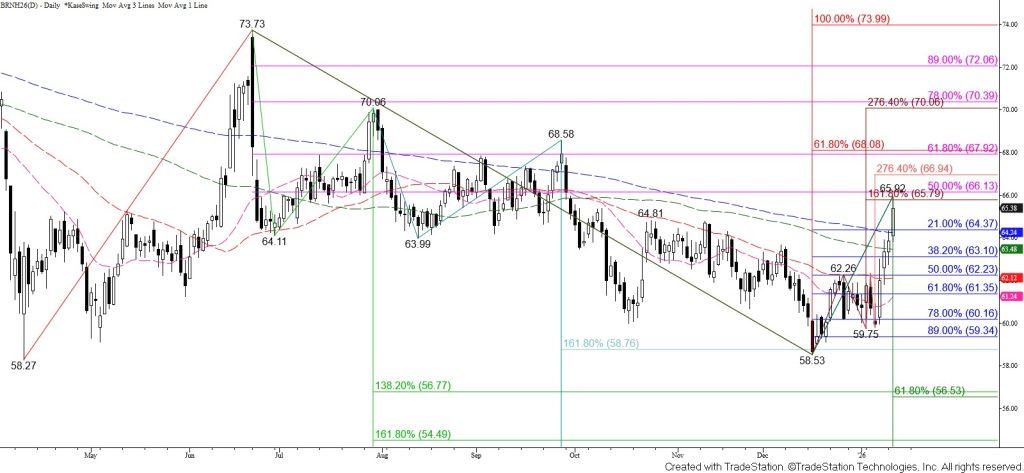
Brent crude oil overcame the $64.81 swing high and settled above the XC (2.764) projection of the first wave up from $58.53, the 38 percent retracement of the decline from $73.73, and the 100- and 200-day moving averages today. Daily Trend indicators are bullish, prices are trading above the 20-, 50-, 100-, and 200-day moving averages, and the move above the $64.81 swing high breaks the trend down from $73.73. There is also a double bottom between the $58.27 and $58.53 swing lows. A broader bullish trend is emerging and would be confirmed by a sustained close above the smaller than (0.618) target of the wave up from $58.27 and the 62 percent retracement from $73.73 at $68.0.
The $65.8 larger than (1.618) target of the primary wave up from $58.53 was held on a closing basis. The daily Stochastic is overbought, but there are no bearish patterns or signals that call for a reversal. Therefore, the outlook for tomorrow is bullish. Settling above $66.1 will call for $66.9 and likely a push to challenge $68.0 in the coming days.
Nevertheless, the move up is due for a test of support, and the $65.8 larger than target of the primary wave up from $58.53 is a prime level from which a correction could occur. Again, there are no bearish patterns or signals that call for such a move, but caution is warranted. Should Brent crude oil fall tomorrow, look for key near-term support at $64.1. Settling below this will take out today’s open and the 200-day moving average, opening the way for a deeper test of support with the next threshold at $63.1.