Natural Gas Price Forecast – August 26, 2020

Natural Gas Near-Term Outlook

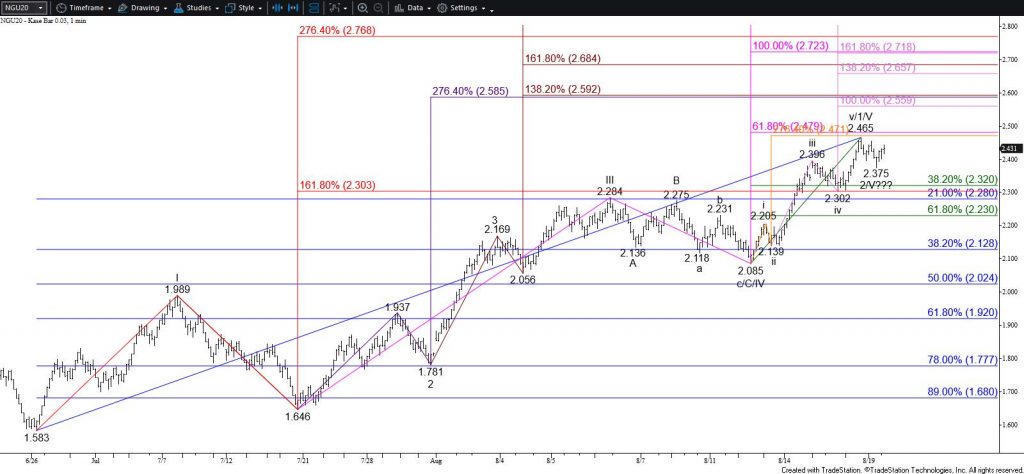
Tomorrow’s outlook for October natural gas leans negative after confirming an intra-day double top that formed between the $2.658 and $2.654 swing highs. The double top was confirmed by today’s close below the $2.564 swing low and the pattern’s target is $2.47. Double tops like this one meet their target 64 percent of the time.

Natural Gas - Double Top on $0.015 Kase Bar Chart
Natural Gas – Double Top on $0.015 Kase Bar Chart

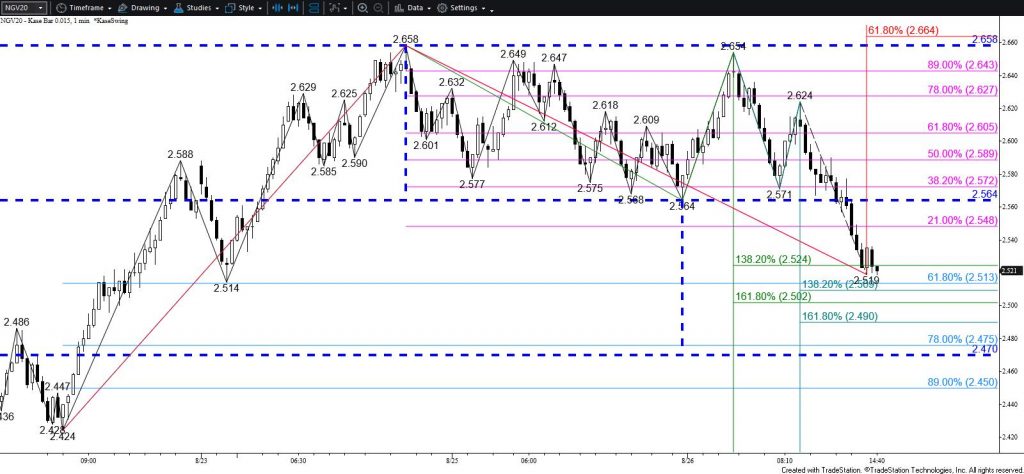
The decline will not likely last much longer because the move down from $2.658 forms a corrective wave in a larger scale five-wave uptrend. There is also immediate support at $2.50 that may prove to be a stalling point early tomorrow. This is in line with the larger than (1.618) target of the primary wave down from $2.658 and the 62 percent retracement of the rise from $2.424. Therefore, closing below $2.47 is doubtful. However, this would clear the way for a larger correction to challenge $2.39 and possibly lower.

Once the $2.47 target is met odds for a continued rise will increase. However, should $2.50 hold, look for initial resistance at $2.57, and then $2.61. Settling above $2.61 would strongly imply that the correction is complete and clear the way for $2.67 and higher.

This is a brief analysis for the next day or so. Our weekly Natural Gas Commentary and daily updates are much more detailed and thorough energy price forecasts that cover key natural gas futures contracts, calendar spreads, the UNG ETF, and several electricity contracts. If you are interested in learning more, please sign up for a complimentary four-week trial.

Natural Gas Near-Term Outlook

The outlook for natural gas remains bullish because September’s move up from $1.583 is unfolding as a textbook five-wave trend the targets $2.75. The more recent rise from $2.085 forms a likely Wave 1/V that has broken down into five sub-waves that stalled at $2.465 yesterday. The decline from $2.465 is corrective and probably forms Wave 2/V. Settling above $2.48 will indicate that Wave 3/V is underway and would call for $2.55 and higher.

Natural Gas – Five-Wave Trend on a $0.03 Kase Bar Chart

Nevertheless, today’s hanging man and a confirmed daily bearish MACD divergence indicate a deeper test of support might take place first. Falling below $2.39 early tomorrow will call for $2.32. This level is expected to hold because it is the 38 percent retracement of the rise from $2.085. Settling below $2.32 will all for Wave 2/V to challenge $2.28 and possibly $2.23. For the five-wave trend to continue to unfold as expected $2.23 must hold.

This is a brief analysis for the next day or so. Our weekly Natural Gas Commentary and daily updates are much more detailed and thorough energy price forecasts that cover key natural gas futures contracts, calendar spreads, the UNG ETF, and several electricity contracts. If you are interested in learning more, please sign up for a complimentary four-week trial.

Natural Gas Near-Term Outlook

The overall outlook for natural gas is bullish because the move up from $1.583 looks to be forming a five-wave trend. Wave I fulfilled its $2.30 larger than (1.618) target when prices rose to $2.284. This was likely the top of Wave III and the subsequent move down is forming Wave IV. Today’s pseudo hammer suggests the corrective Wave IV may be complete, or at least that it is nearing completion.

Tomorrow, look for a test of $2.21. This is the 62 percent retracement of the decline from $2.284. A close above this would strongly imply that the corrective Wave IV is complete and would call for $2.30 to be challenged again. Settling above $2.30 will confirm that Wave V is underway.

Conversely, based on the wave formation down from $2.284, there is still a reasonable chance for Wave IV to extend to $2.03 before Wave V forms. Should natural gas fall below $2.09 early tomorrow, or hold $2.21 and then take out $2.13, look for the corrective move down to reach $2.03. Support at $2.03 is expected to hold because this is the larger than target of the primary wave down from $2.284 and the 38 percent retracement of the rise from $1.583.

Settling below $2.03 is unlikely. This would imply that the move up is not a five-wave trend but rather a nested three-wave pattern. While this would still be bullish for the long-term, it would delay the likelihood of natural gas rising above $2.30 for at least another next few weeks.

This is a brief analysis for the next day or so. Our weekly Natural Gas Commentary and daily updates are much more detailed and thorough energy price forecasts that cover key natural gas futures contracts, calendar spreads, the UNG ETF, and several electricity contracts. If you are interested in learning more, please sign up for a complimentary four-week trial.

Natural Gas Near-Term Oulook

The outlook for natural gas has taken on a much more bullish tone after breaking higher out of the months-long trading range between nominally $1.60 and $1.93 on Monday. The move up stalled at $2.261 today but is still poised to challenge $2.30. This is the most confluent wave projection and a crucial objective for September’s primary wave up from $1.583 and the continuation charts primary wave up from $1.432. Settling above $2.30 may initially be a challenge but will clear the way for $2.37 and likely $2.44.

Natural Gas – $0.03 Kase Bar Chart

Nevertheless, the pullback after reaching $2.261 formed a long upper shadow on the daily candlestick. The body of today’s candlestick is too big to form a shooting star, but the long upper shadow suggests the move up may be nearing exhaustion. Several daily momentum oscillators are also sitting just below overbought territory. Therefore, a significant test of support may take place soon; most likely once the $2.30 objective is fulfilled.

The move down from $2.261 this afternoon has been choppy and is most likely corrective. Even so, there is a reasonable chance for this correction to challenge $2.13 early tomorrow. Support at $2.13 is expected to hold. A move below this will call for key near-term support at $2.03. This is the lowest the first wave down from $2.261 projection and is the 38 percent retracement of the rise from $1.646. Settling below $2.03 is doubtful but would significantly dampen odds for a continued rise to $2.30 and higher during the next few days.

This is a brief analysis for the next day or so. Our weekly Natural Gas Commentary and daily updates are much more detailed and thorough energy price forecasts that cover key natural gas futures contracts, calendar spreads, the UNG ETF, and several electricity contracts. If you are interested in learning more, please sign up for a complimentary four-week trial.

Natural Gas Price Forecast

September natural gas settled above the crucial $1.90 level today. This was the smaller than (0.618) target of the primary waves up from $1.583 and $1.646. Most importantly, $1.90 has been near the top of the trading range on the continuation chart since mid-May and was the smaller than target of the wave up from $1.432.

Closing above $1.90 was bullish for the near-term outlook and calls for prices to challenge $2.00 and possibly $2.07. For September $2.00 is the equal to (1.00) target of the wave up from $1.646 and $2.07 is the equal to target of the larger wave up from $1.583. Therefore, September’s wave formation calls for prices to eventually reach $2.07. However, $2.00 is a psychologically important threshold that is in line with the 200-day moving average on the continuation chart. Therefore, natural gas will likely be hard-pressed to overcome $2.00 during the next few days and perhaps even the next several weeks.

Natural Gas – $0.02 KaseBar Chart

Also, with August expiring at $1.854 today prompt month prices may be drawn down to close the rollover gap before rising much higher.

Nevertheless, there are no confirmed patterns or signals that call for the move up to stall before reaching at least $1.95 and likely $2.00.

Should natural gas turn lower early tomorrow, look for initial support at $1.88 and then $1.83. These are the 21 and 38 percent retracements of the move up from $1.646. At $1.83 the rollover gap up from $1.854 will be filled. Therefore, this level is expected to hold. Closing below $1.83 will provide more evidence that prices are still trading in a wide range between nominally $1.60 and $1.90 for the interim.

This is a brief analysis for the next day or so. Our weekly Natural Gas Commentary and daily updates are much more detailed and thorough energy price forecasts that cover key natural gas futures contracts, calendar spreads, the UNG ETF, and several electricity contracts. If you are interested in learning more, please sign up for a complimentary four-week trial.

Natural Gas Price Forecast

Natural gas rallied again today after falling to $1.622 in early trading hours. The subsequent move up met the $1.698 equal to (1.00) target of the wave up from $1.605. This wave is now poised to reach its $1.73 intermediate (1.382) target tomorrow. This is also the 38 percent retracement of the decline from $1.924 and is in line with the 21-day moving average. Closing above $1.73 would imply that support around $1.60 will continue to hold and that prices are settling into a wide trading range between nominally $1.60 and $1.86 for the interim.

Natural Gas – $0.02 KaseBar Chart

Nevertheless, the move up may still be corrective, and until at least $1.73 is overcome there is still a reasonable chance for the move down to extend. For now, though, support at $1.64, the 62 percent retracement of the rise from $1.605, is expected to hold. Falling below this will call for another attempt at $1.59. Settling below $1.59 would confirm a break below the critical $1.60 level and shift near-term odds in favor of $1.51 and possibly lower before the August contract expires on July 29.

This is a brief analysis for the next day or so. Our weekly Natural Gas Commentary and daily updates are much more detailed and thorough energy price forecasts that cover key natural gas futures contracts, calendar spreads, the UNG ETF, and several electricity contracts. If you are interested in learning more, please sign up for a complimentary four-week trial.

Natural Gas Price Forecast

Natural gas could not break support at $1.70 and make the push for $1.66 during the last few days. Support at $1.70 is the larger than (1.618) target of the first wave down from $1.924 (dark cyan) and is marginally below the 50 percent retracement of the rise from $1.517 (blue). The subsequent wave up from $1.708 (orange) accelerated this afternoon and is testing its equal to (1.00) target and the 38 percent retracement of the decline from $1.924 (dark red). This is positive for the near-term outlook.

Natural Gas – $0.02 KaseBar Chart

Because $1.70 held and based on this afternoon’s move up, near-term odds have shifted in favor of challenging at least $1.84 tomorrow. This is the larger than target of the wave up from $1.708 (orange) and the 62 percent retracement of the decline from $1.924 (dark red). Settling above this will call for $1.91, which then connects to $1.96 and higher.

Nevertheless, while $1.84 holds, there is a modest chance for the move down to extend to $1.66. Falling below the $1.728 swing low will increase odds for $1.66 because this would invalidate the wave up from $1.708 (orange) that makes the connection to $1.84 and $1.91. Support at $1.66 is key for the near-term outlook and is expected to hold. Closing below this would call for another test of $1.59 and possibly lower.

This is a brief analysis for the next day or so. Our weekly Natural Gas Commentary and daily updates are much more detailed and thorough energy price forecasts that cover key natural gas futures contracts, calendar spreads, the UNG ETF, and several electricity contracts. If you are interested in learning more, please sign up for a complimentary four-week trial.

Natural Gas Price Forecast

Natural gas has adopted a bullish outlook for the remaining summer months after rallying to a high of $1.924. This was the equal to (1.00) target of the August contract’s primary wave up from $1.517 and was in line with the 50-day moving average. However, today’s bearish engulfing line calls for a deeper test of support before the move up continues above $1.92 to challenge $1.98 and higher.

Based on the wave formation down from $1.924 and the retracements of the move up from $1.517, August natural gas should fall to at least $1.78 and likely $1.73 before settling above $1.92. The $1.73 objective will most likely hold. Once this target is met, odds for another test of $1.92 will begin to increase.

Natural Gas – $0.02 KaseBar Chart

Nevertheless, closing below $1.73 would call for key support at $1.67 to be challenged. This is the larger than (1.618) target and the 62 percent retracement. Settling below $1.67 is doubtful but would reflect a bearish shift in external factors (e.g. weather and/or supply and demand). This would then call for another test of $1.60 and possibly lower.

During the next day or so, as prices fall to challenge support, resistance at $1.88 should hold. Rising above this will call for another test of $1.92. An eventual close above $1.92 is expected and will clear the way for $1.98 and higher.

This is a brief analysis for the next day or so. Our weekly Natural Gas Commentary and daily updates are much more detailed and thorough energy price forecasts that cover key natural gas futures contracts, calendar spreads, the UNG ETF, and several electricity contracts. If you are interested in learning more, please sign up for a complimentary four-week trial.

Natural Gas Price Forecast

After prompt month natural gas prices fell to a 25 year low of $1.432 late last week prices quickly bounced to challenge important resistance at $1.77. A move like this is common after such a significant decline but does not necessarily mean a bottom has been made.

So far, resistance at $1.77 has held on a closing basis. This level is still a factor because it is August’s 21-day moving average and the 50- and 100-day moving average on the continuation chart. Also, today’s bearish engulfing line and the intra-day waves down from $1.784 call for a deeper test of support. Tomorrow, look for a test of $1.62, a close below which will call for $1.55 and possibly $1.51.

Natural Gas – Daily Chart

Nevertheless, should $1.62 hold and prices settle above $1.77, there is a good chance that a bottom has been made and that prices are settling back into a trading range for the interim. In this case, natural gas should rise toward major resistance at $1.87. For now, unless there is a bullish shift in supply/demand factors, $1.87 is expected to hold.

This is a brief analysis for the next day or so. Our weekly Natural Gas Commentary and daily updates are much more detailed and thorough energy price forecasts that cover key natural gas futures contracts, calendar spreads, the UNG ETF, and several electricity contracts. If you are interested in learning more, please sign up for a complimentary four-week trial.

Natural Gas Price Forecast

Today, the focus of the natural gas analysis is switched to the August contract due to July’s expiration on Friday, June 26.

On a side note, July’s close below $1.60 today puts the prompt month in position to reach at least $1.54 and possibly $1.49 before expiration. However, given the time constraint, reaching $1.49 will be a challenge. Therefore, it looks like the continuation chart’s $1.519 swing low may continue to hold for now.

The August natural gas contract fell to a new contract low of $1.652 today and continues to extend its long-term downtrend. There is some support around $1.65 for a few of the recent waves down from $1.96 and $1.915. However, based on the larger waves and sub-waves, August natural gas is poised to challenge $1.60. This has been strong support for the past several weeks on the continuation chart and should be stiff support for August. The $1.60 target is highly confluent and is the equal to (1.00) target of the primary wave down from $2.447.

Natural Gas – Daily Chart

Once the $1.60 objective is met, another test of resistance is anticipated before the decline continues. Nevertheless, closing below $1.60 will call for $1.55 and likely $1.51, where the continuation chart’s $1.519 swing low will be challenged.

A few daily momentum oscillators are oversold and setup for bullish divergence. Otherwise, there are no confirmed bullish patterns or signals that indicate the move down will stall. Even so, should August rally early tomorrow, look for initial resistance at $1.70 and key near-term resistance at $1.74. Settling above $1.74 will shift near-term odds in favor of a larger correction to test $1.82. This is the 21 percent retracement of the decline from $2.447 and the 21-day moving average.

This is a brief analysis for the next day or so. Our weekly Natural Gas Commentary and daily updates are much more detailed and thorough energy price forecasts that cover key natural gas futures contracts, calendar spreads, the UNG ETF, and several electricity contracts. If you are interested in learning more, please sign up for a complimentary four-week trial.