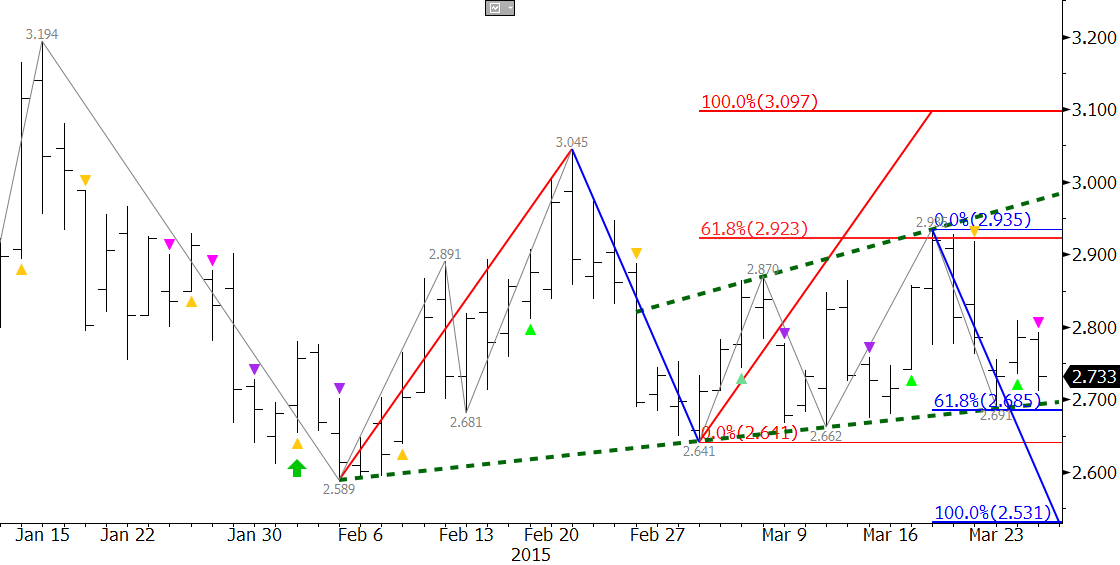
Natural gas prices are still oscillating in the upward sloping range that began March 3 when the $2.641 swing low was made. The lower trend line of the formation, which connects back to the $2.589 contract low, was tested, but held again on Monday. Most pundits indicate the long-term fundamentals are bearish, but this begs the questions, why hasn’t the market broken lower yet? This is one of many areas that technical analysis can help answer that question and give us a good idea of where the market will go once it breaks out of this range.
The chart below tells us everything we need to know about the outlook for natural gas in the near term, and can give us an idea about the longer-term outlook too. This is a very short-term analysis, so we will focus on those factors. Technical factors are showing that the market does agree with the bearish fundamentals, and that a break lower should take place soon, but that there are still enough positive factors like late winter weather in the Northeast to support prices for now.

The range that has formed over the past few weeks is an expanding wedge (shown in green), and a break out of this pattern will solidify direction for natural gas prices. The break out points for the pattern at $2.69 and $2.94 are in line with the 0.618 projections for the wave up from $2.589 (show in in red) and down from $3.045 (shown in blue). The confluence of these points tells us that a close below $2.69 would open the way for the 1.00 projection of $2.53, and a close over $2.94 would call for an extended correction to $3.10.
The expanding wedge and the Fibonacci wave projections give us a solid forecast once the market breaks out of the wedge. The wedge is a corrective pattern, and because the market entered the pattern after declining from $3.045, a break lower out of the wedge is favored. The negative bias is also confirmed by the KaseX’s most recent yellow and pink down triangles.
In summary, the near-term outlook is negative and a bearish U.S. Energy Information Administration (EIA) Natural Gas Weekly Update tomorrow would likely be the catalyst to achieve the expected break lower out of the expanding wedge. A close below $2.69 will confirm the break lower and call for at least $2.53. Conversely, a close over $2.94 would call for an extended correction to $3.10.
Take a trial of Kase’s in-depth weekly Natural Gas Forecast.

