WTI Crude Oil Technical Analysis and Short-Term Forecast
This is a brief analysis for the next day or so. Our weekly Crude Oil Forecast and daily updates are much more detailed and thorough energy price forecasts that cover WTI, Brent, RBOB Gasoline, Diesel, and spreads. If you are interested in learning more, please sign up for a complimentary four-week trial.
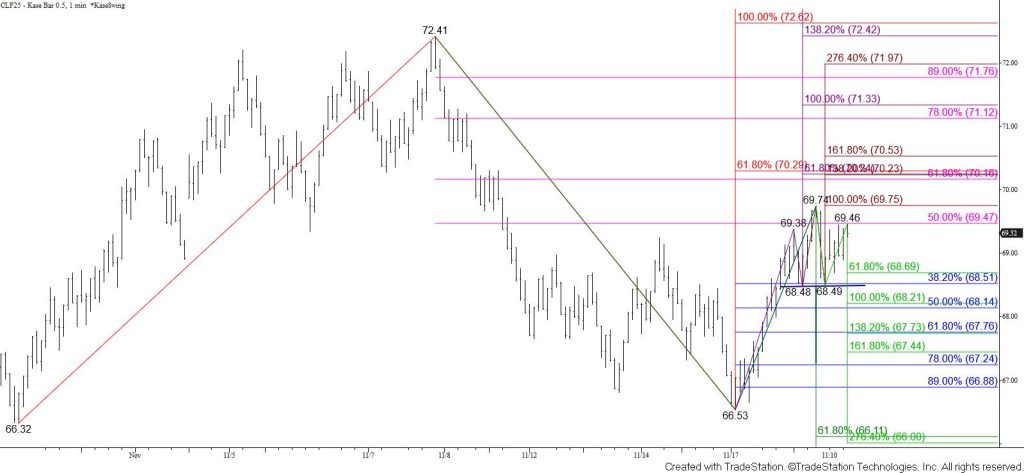
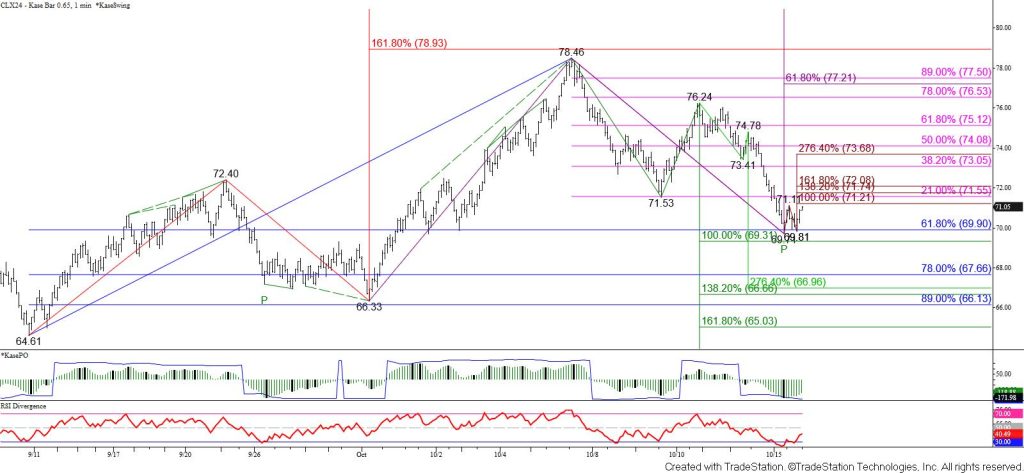
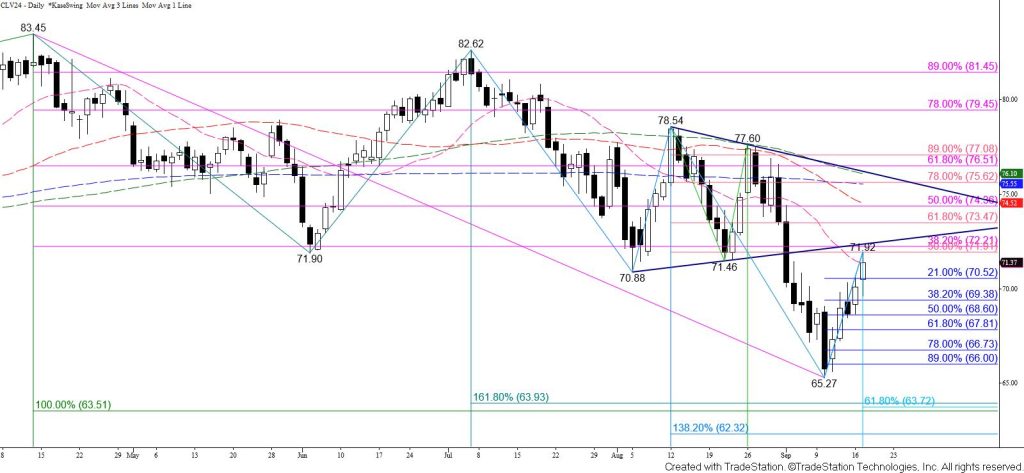
Tomorrow’s outlook for January WTI crude oil leans bullish given Monday’s bullish engulfing line. One could also make a case for a double bottom between the $66.32 and $66.53 swing lows. However, the longer-term outlook for WTI crude oil remains bearish and the move up from $66.53 is likely another correction. Furthermore, this is a tight call for tomorrow given today’s lackluster move up and the formation of an intra-day head and shoulders pattern.
The key for a larger test of resistance is an early move above the $69.8 smaller than (0.618) target of the wave up from $68.48. Such a move would negate the head and shoulders pattern and call for a test of this wave’s $70.3 equal to (1.00) target. The $70.3 objective is crucial because it is also the smaller than target of the waves up from $66.32 and $66.53. Closing above $70.3 would call for the $71.3 equal to target of the wave up from $66.53 and then a test of the $72.5 equal to target of the wave up from $66.32. The $72.5 objective is in line with the $72.41 confirmation point of the debatable $66.32/$66.53 double bottom.
That said, falling below $68.5 before rising to $69.8 would confirm the intra-day head and shoulders pattern. Below $68.5 look for support at $67.8. This is the intermediate (1.382) target of the wave down from $69.74 and the 62 percent retracement of the rise from $66.53. Closing below $67.8 would strongly suggest that the move up from $66.53 is a completed correction. Settling below $67.3, which is in line with this wave’s larger than (1.618) target and the target of the head and shoulders, would confirm a bearish outlook for the coming days.