Natural Gas Technical Analysis and Near-Term Outlook
This is a brief analysis for the next day or so. Our weekly Natural Gas Commentary and daily updates are much more detailed and thorough energy price forecasts that cover key natural gas futures contracts, calendar spreads, the UNG ETF, and several electricity contracts. If you are interested in learning more, please sign up for a complimentary four-week trial.
February natural gas rose today, confirming daily bullish KasePO, RSI, Stochastic, and MACD divergences. These bullish momentum signals reflect exhaustion and call for a larger test of resistance before the downtrend extends and tests a highly confluent area of support between $3.30 and $3.20.
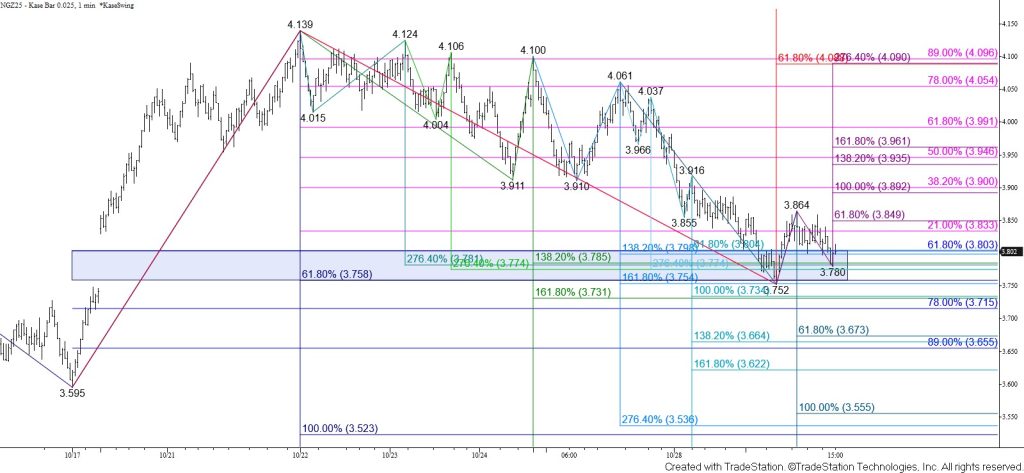
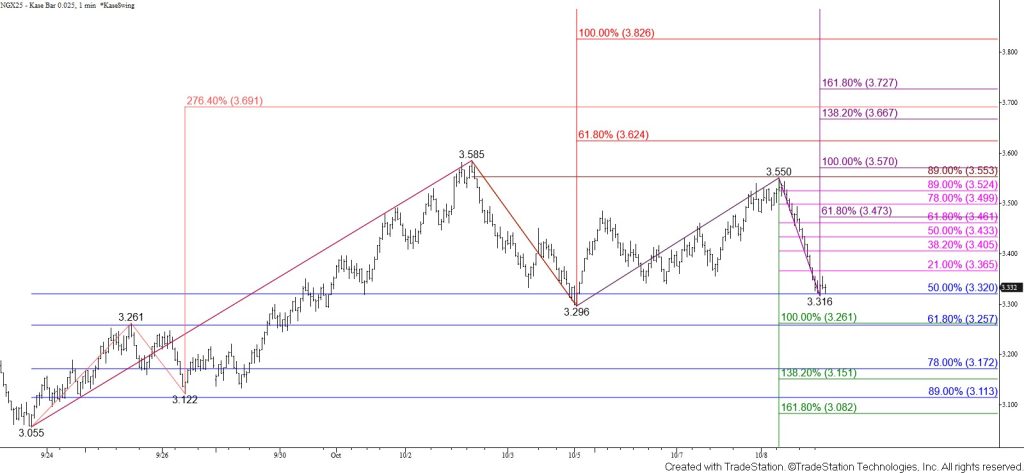
The intraday wave up from $3.324 met and held its $3.59 smaller than (0.618) target. Another test of $3.59 is expected, a move above which will call for the $3.67 equal to (1.00) target to be fulfilled. This is also the 38 percent retracement of the decline from $4.176. A simple correction will hold $3.67. Settling above $3.67 will call for an extended correction to challenge $3.77 and possibly $3.83. Settling above $3.83, which is in line with the larger than (1.618) target of the wave up from $3.324 and the 62 percent retracement from $4.176, would indicate that a substantial test of resistance is underway.
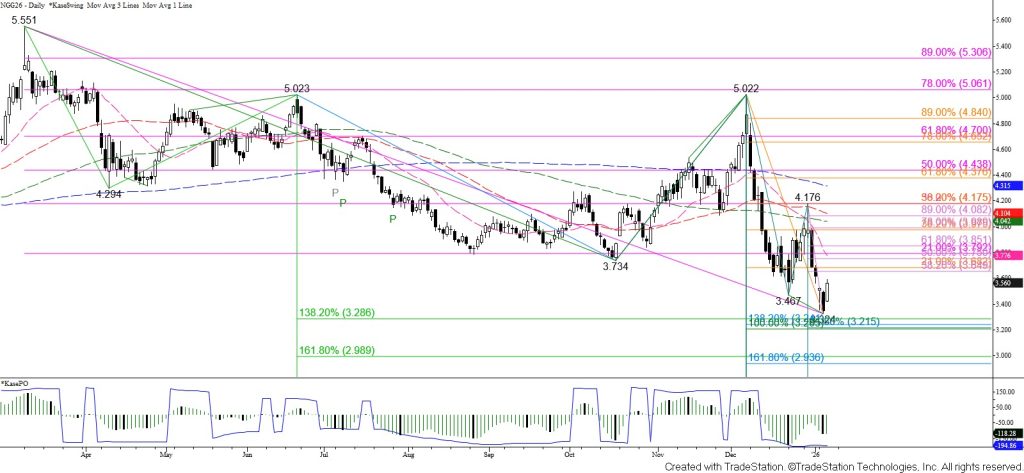
Nonetheless, the downtrend remains intact, and the top of Monday’s gap down from $3.563 held on a closing basis. The gap might still prove to be an exhaustion pattern should prices settle above the $3.59 target. Otherwise, should $3.59 hold, and prices close below $3.43, look for another attempt to take out key near-term support at $3.30. This is the smaller than (0.618) target of the first wave down from $3.324 and the intermediate (1.382) target of the first wave down from $5.551. Settling below $3.30 would put the odds in favor of testing the $3.20 equal to target of the primary wave down from $5.551. This is another probable stalling point for the February natural gas contract.