Natural Gas Technical Analysis and Near-Term Outlook
This is a brief analysis for the next day or so. Our weekly Natural Gas Commentary and daily updates are much more detailed and thorough energy price forecasts that cover key natural gas futures contracts, calendar spreads, the UNG ETF, and several electricity contracts. If you are interested in learning more, please sign up for a complimentary four-week trial.
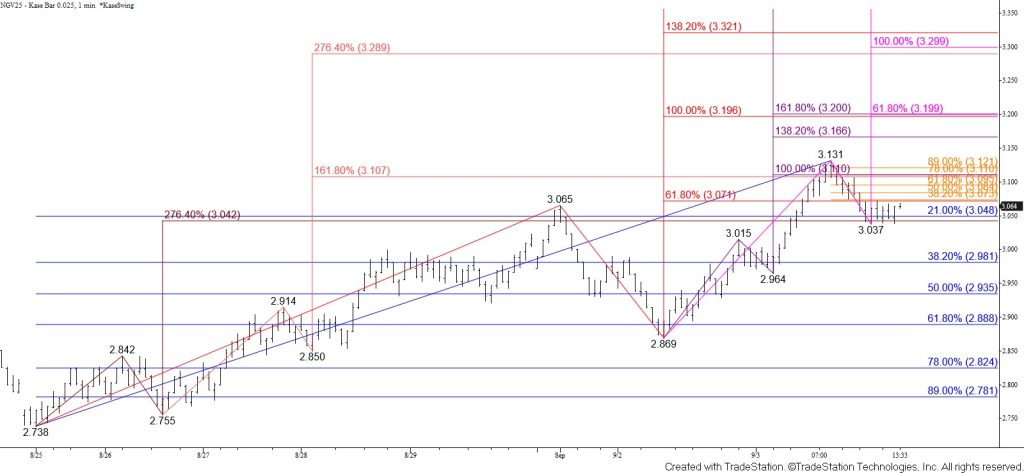
Natural gas continued to rise, and a weekly bullish engulfing line and weekly bullish KaseCD divergence indicate that a reversal might be underway. The daily Kase Trend indicator flipped to bullish today and the 10-day DMI has shifted to neutral. It is still too soon to definitively state that a bottom has been made. However, the wave formation up from $2.738 calls for a test of $3.20. This is a highly confluent wave projection that is near the upper Bollinger Band. Closing above $3.11 will call for $3.17, which then connects to $3.20. Settling above $3.20 will provide more evidence that a bottom has been made and open the way for $3.26 and higher.
That said, today’s intraday bounce up from $3.037 held the 38 percent retracement of the decline from $3.131. Therefore, a deeper test of support might occur first. Taking out $3.02 would call for a test of key near-term support at $2.97. This level is in line with the 38 percent retracement of the rise from $2.738. A normal correction of the rise from $2.738 should hold $2.97. Settling below this would put the near-term odds in favor of a more significant test of support where the next major threshold is the 62 percent retracement at $2.89. Settling below $2.89 would imply that the move up from $2.738 is a completed correction of the long-term downtrend.