Gold Technical Analysis and Near-Term Outlook
This is a brief analysis for the next day or so. Our weekly Metals Commentary and daily updates are much more detailed and thorough energy price forecasts that cover key COMEX precious metals futures contracts and LME Non-Ferrous (Base) metals, spot gold, the gold/silver ratio, and gold ETFs. If you are interested in learning more, please sign up for a complimentary four-week trial.
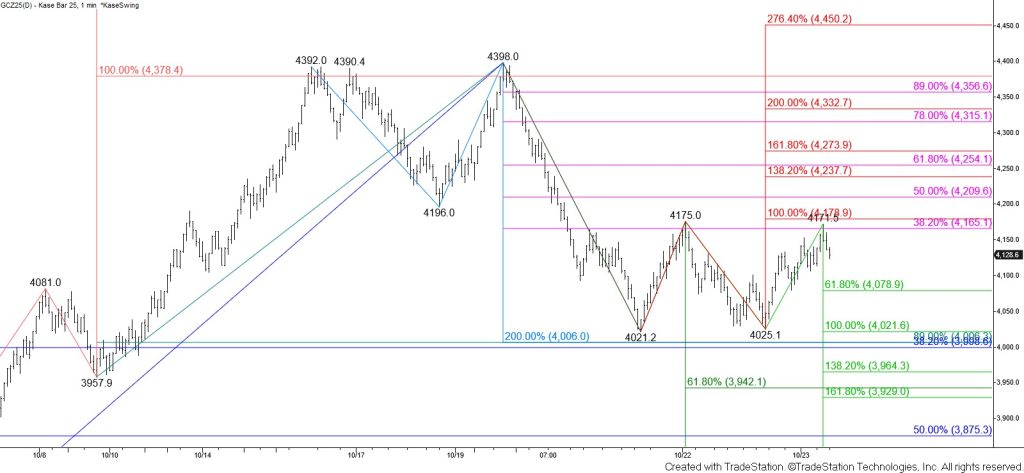
December gold rose to test and hold the $4175 confirmation point of an intraday double bottom that formed around $4023. The outlook remains bearish given Tuesday’s bearish engulfing line, daily bearish momentum signals that were confirmed at the $4398 high, and the confirmation of a double (one could argue, triple) top that formed around $4396 that targets $4006. The daily Kase Trend indicator is now bearish, and the 10-day DMI is poised for a bearish crossover.
However, in addition to the formation of an intraday double bottom at $4023, the trendline up from $3353.4 and the 20-day moving average were both tested and held on Wednesday. Therefore, it may be premature to state that a top has been made and that a bearish reversal or a long period of consolidation is underway.
The key levels to watch ahead of the weekend and possibly for the next few days are $4011 and $4259.
The outlook leans bearish for tomorrow, and taking out the $4079 smaller than (0.618) target of the wave down from $4175 will call for a test of $4011. This objective is key because it is in line with the target of the $4396 double top, the equal to (1.00) target of the wave down from $4175, the 89 percent retracement from $3957.9, and the 38 percent retracement from $3353.4. Settling below $4011 will also break the trendline up from $3353.4 and take out the 20-day moving average. Therefore, settling below $4011 would provide more strong evidence that a bearish reversal will continue to unfold and that prices will ultimately consolidate into a range.
Nevertheless, settling above $4175 will confirm the $4023 double bottom and call for a push to fulfill this pattern’s $4333 target. In this case, a test of key near-term resistance at $4259 would occur. The $4259 level is key because it is the larger than (1.618) target of the wave up from $4021.2 and the 62 percent retracement from $4398. Typically, a close above the 62 percent retracement suggests that the decline from the measurement’s high is complete. Therefore, settling above $4259 will shift the odds in favor of a continued rise to $4333 and likely to retest the $4396 double top.