Gold Technical Analysis and Near-Term Outlook
This is a brief analysis for the next day or so. Our weekly Metals Commentary and daily updates are much more detailed and thorough energy price forecasts that cover key COMEX precious metals futures contracts and LME Non-Ferrous (Base) metals, spot gold, the gold/silver ratio, and gold ETFs. If you are interested in learning more, please sign up for a complimentary four-week trial.
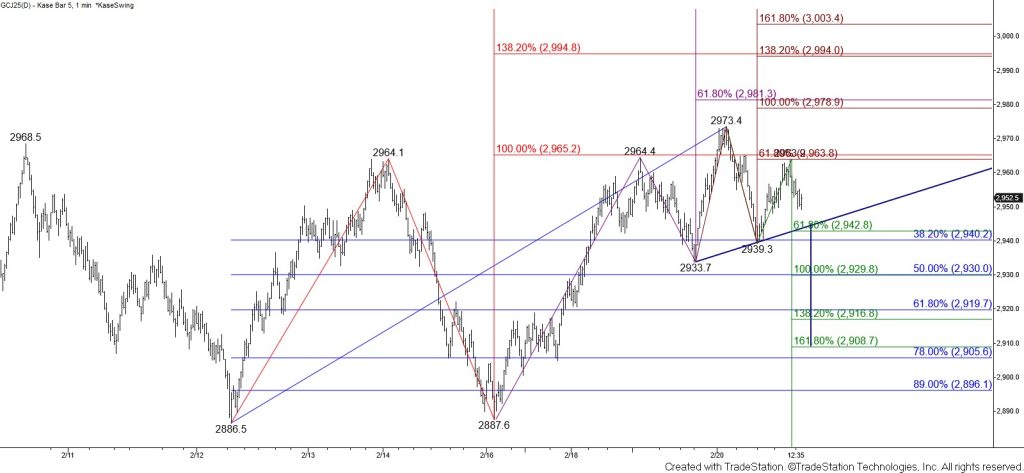
Gold is struggling to close above the $2965 equal to (1.00) target of the wave up from $2886.5. This would confirm a break higher out of the range between $2887 and $2965 that prices have been trading in since February 11. Prices briefly rose above the $2965 target today but stalled at $2973.4 before pulling back again. The pullback held the 38 percent retracement of the rise from $2886.5 and then rose to test and hold $2965 again.
Prices are still trading near the top of the range and another test of $2965 is expected. Settling above this will confirm a break higher and open the way for tests of $2980 and likely $2997 in the coming days.
That said, this is a tight call ahead of the weekend. The indecisive trading that has taken place for the past two days has formed an intra-day head and shoulders pattern on the $5 Kase Bar chart. The challenge for this pattern is that the neckline is upward sloping. Head and shoulders patterns with upward sloping necklines generally do not perform as well as those with a flat or downward sloping neckline. Nonetheless, this pattern and today’s doji warn that another test of support within the range might take place before closing above $2965.
Closing below $2943, the smaller than (0.618) target of the wave down from $2973.4 will confirm a break of the neckline and open the way for $2930 and then a test of the $2909 target of the head and shoulders. This is also the larger than (1.618) target of the wave down from $2973.4. The $2909 level is key support for the near term because settling below this will put the odds in favor of another test and attempt to take out the bottom of the range at $2887.