Natural Gas Technical Analysis and Near-Term Outlook
This is a brief analysis for the next day or so. Our weekly Natural Gas Commentary and daily updates are much more detailed and thorough energy price forecasts that cover key natural gas futures contracts, calendar spreads, the UNG ETF, and several electricity contracts. If you are interested in learning more, please sign up for a complimentary four-week trial.
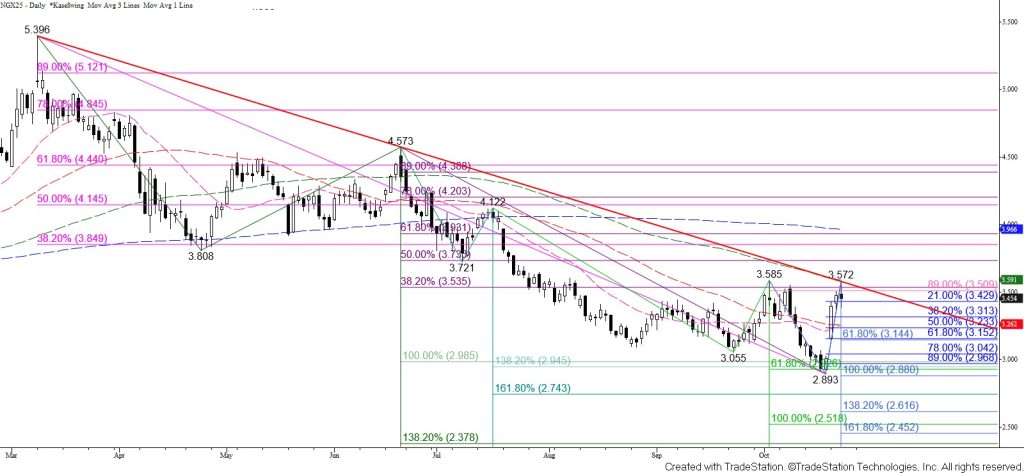
Natural gas rose to $3.572 and challenged the major trendline down from $5.396 and the 100-day moving average before pulling back and forming a daily long-legged doji. This candlestick pattern reflects near-term uncertainty and warns that a deeper test of support might occur before prices overcome the last major swing high at $3.585 and break above the trendline and the 100-day moving average. Even so, Monday’s breakaway gap, a daily bullish RSI divergence, and confirmed daily oversold signals strongly suggest that a bullish reversal is underway. Therefore, a deeper pullback will likely prove to be the corrective leg of a primary wave up from $2.893.
The outlook remains bullish, and overcoming $3.53 will call for a test of $3.60. This will overcome the $3.585 swing high, and a close above $3.60 will confirm a break above the trendline down from $5.396 and the 100-day moving average. This will also open the way for $3.65 and likely $3.74 in the coming days.
Nevertheless, there is a reasonable chance for a test of the $3.36 intermediate (1.382) target of the wave down from $3.572 and the equal to (1.00) target of the wave down from $3.553 first. Falling below $3.36 would call for a test of the 38 percent retracement of the rise from $2.893 at $3.31. A simple correction will hold $3.31. Settling below $3.31 would call for an extended correction to challenge $3.23 and possibly major support at $3.14. Closing below $3.14, the 62 percent retracement and smaller than (0.618) target of the wave down from $3.585, would imply that the move up has failed.