By Dean Rogers
The world’s supply of crude oil continues to outpace demand, and consequently the global supply glut is being forecast through 2016. WTI fell to its lowest level in over six years last week and Brent is inching its way closer to testing the $45.19 low made on January 13, 2015. A move below this would be the lowest price at which Brent has traded at in over six years.
Structurally, the market is overdue for a correction and Brent’s daily morning star setup, a bullish candlestick pattern, warns that such a correction might take place soon. The decline’s momentum is also weakening, and there are daily and weekly divergence setups for Brent.
Brent and products attempted to stabilize and even rise in a corrective manner last week, but the move stalled. On Friday Brent crude broke lower out of the intraday coil shown below on the $0.50 Kase Bar chart.
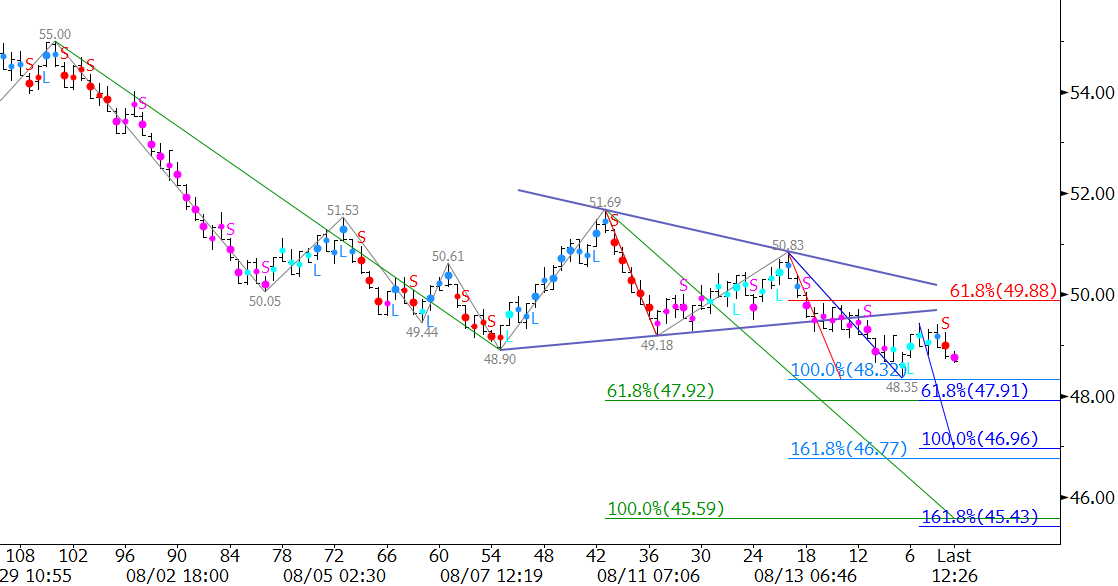
The break lower out of the coil indicates the decline should continue. The waves projections down from $55.0 (green), $51.69 (light blue), and $50.83 (blue) call for at least $47.9. This is a confluent wave projection that connects to $46.9 and finally $45.5.
The move down is becoming a grind, but until Brent crude can close over at least $49.9, look for the move down to extend. A close over $49.9 would at least create the potential for an extended upward correction.
This is a brief analysis and outlook for the near-term. Our weekly Crude Oil Commentary is a much more detailed and thorough energy price forecast. If you are interested, please sign up for a complimentary four week trial.