
Gold Price Forecast
The long-term outlook for gold is bullish and $1820 is the next major objective. However, gold is stuck in a trading range and the lower trend line of the range was broken yesterday. Also, the recent decline below the smaller than (0.618) targets of the primary waves down from $1789.0 and $1787.5 suggests a test of the lower end of the range around $1670 might take place before a break higher.
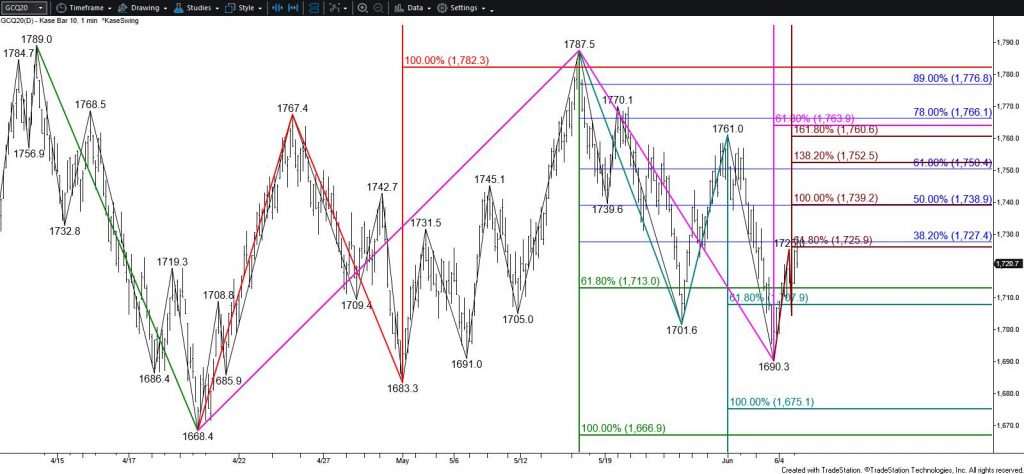
Nevertheless, today’s settle above Wednesday’s midpoint and the formation of a bullish piercing pattern on the daily chart call for a test of at least $1740 and possibly $1751 first. Resistance at $1751 is expected to hold. Rising above this would call for key resistance at $1690 to be challenged. Settling above $1690 would shift near-term odds back in favor of $1780, which then makes a connection to targets above the upper trend line of the trading range.
In summary, technical analysis factors are mixed. The long-term outlook is bullish, near-term odds favor a test of $1670 before breaking higher out of the trading range, and a test of at least $1739 should take place first. This implies that trading will continue to be extremely choppy during the next few days and possibly for another few weeks.
Silver Price Forecast
Silver’s recent decline from the $18.950 swing high is most likely corrective. However, a daily bearish engulfing line and confirmed bearish KaseCD, MACD, and RSI divergences call for a deeper test of support before the move up continues to the next major objective of $19.54.
Tomorrow, look for a test of at least $17.65, which then connects to $17.33. Support at $17.33 is the most confluent objective on the chart and is expected to hold. Closing below this would call for a much more significant test of support before the move up continues.
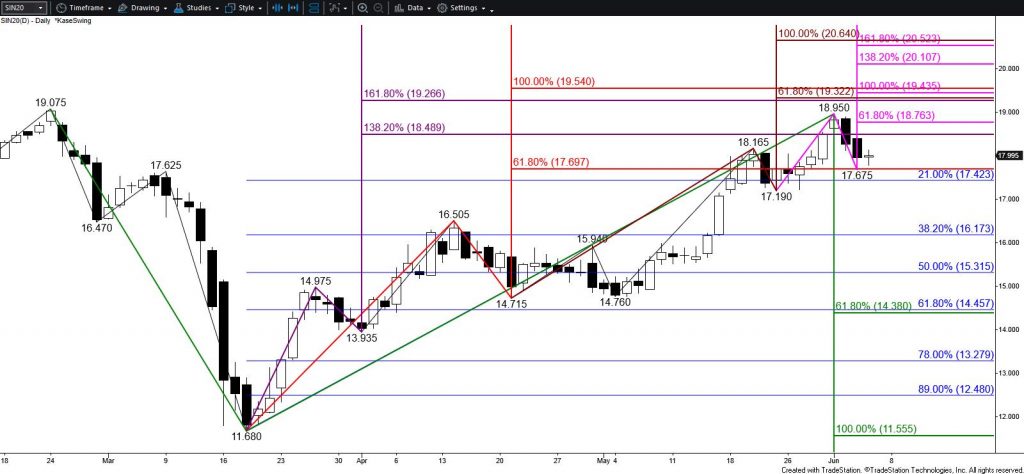
Nonetheless, today’s formation of a doji dampens odds for a larger correction. Should silver rise above $18.17 look for a test of $18.43. The latter is the doji’s confirmation point, a close above which would call for key resistance at $18.78. Settling above $18.78 would indicate the corrective move down is over and clear the way for the push toward $19.54.
This is a brief analysis for the next day or so. Our weekly Metals Commentary and daily updates are much more detailed and thorough energy price forecasts that cover key COMEX precious metals futures contracts and LME Non-Ferrous (Base) metals, spot gold, the gold/silver ration, and gold ETFs. If you are interested in learning more, please sign up for a complimentary four-week trial.