By  Cynthia Kase
Read on TraderPlanet.com
The big hotel chains recovered from the financial crisis well and until recent months showed steady gains. Diversification, appealing to differing guests, as well as shifting property ownership to partners helped heat the sector. But now, it looks like supply is catching up with demand, and now the sector is cooling off. To evaluate specifics, I’ve chosen to look at Starwood Hotels & Resorts Worldwide Inc. (HOT) this week as a proxy for its peers.
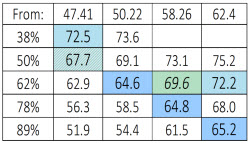
HOT’s been down for four months running, having lost about 14 percent of its value. The first major downside target is $73.0. If that breaks, a freefall to $65 could ensue, but $70, or $67.5 form interim support. These prices are reflected in the retracement tables shown below
Since Friday, there’s been a small correction, but HOT declined today, August 11. $78 could be tested, and a close over next resistance at $81 would call for a recovery.
Starwood (HOT) Technical Indicators
Looking at the technicals, Starwood’s monthly chart generated a negative divergence back in April based on the KaseCD. Four down months have followed, but lows have not yet reached Kase’s first stop level at $72.83. The stop is near a key target, centered on $73.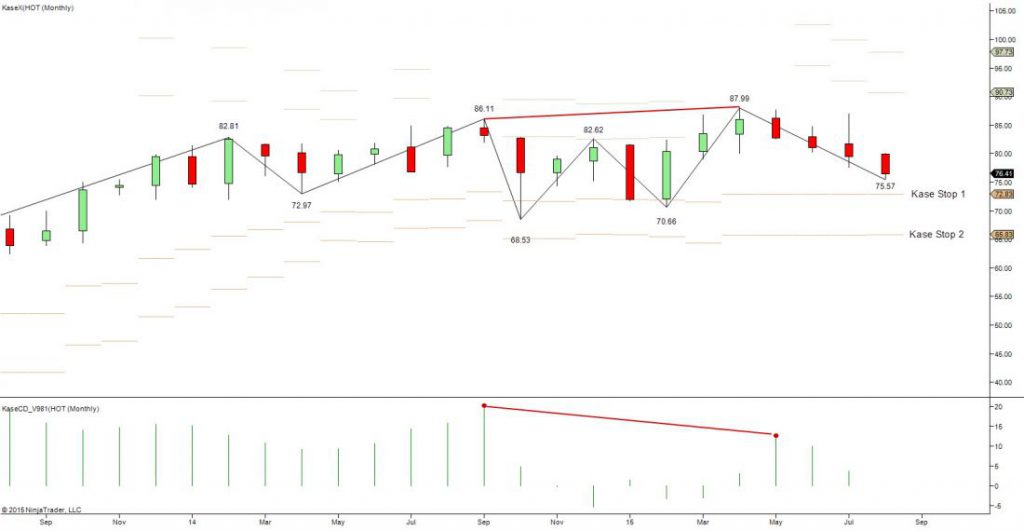
The first wave of a pattern is always the most important. Here that’s 87.99 – 79.53 – 86.96, the 1.62 extension for which is $73. If the pattern extends, look for $65, the trend terminus. This is just above Kase’s second stop at $65.8. The most recent wave is 87.99 – 79.53 – 86.96, and $73 is its equal extension as well as the Phi-squared corrective projection.
Backtracking, July 31 was an aberrant, outside, down day. Prices spiked to $86.96 only make a $77.72 low. $73 and $65 are targeted by this day’s waves.
The last four days through Tuesday for a Harami line with stars. The daily chart is oversold, but not divergent. Prices rose about $1.50 from $75.57, but fell today. The wave up targets $78, which is its equal extension, as well as its Phi corrective projection. The wave also targets $81, using three different calculations. This is the “drop dead” price above which the tone becomes positive, and the highest price to which the small wave projects. These two resistance values are the midpoints for the August (so far) and July monthly candlesticks.
Recommended Starwood (HOT) Trading
If I were short above $86, I’d just stay short, perhaps scaling out at $78 and then $81, and exercising caution at the downside targets. Bearish intraday traders might time in here, but watch $73, and use tighter stops. Technically there is little room for optimism, but if you’re long on fundamentals, then monitor the downside targets. Above $81 – you’re “hot”.
Connect with me on LinkedIn for more Market Updates.