The long-term outlook for gold is bullish and prices are still poised to eventually challenge targets above $1800. However, confluent resistance was met around the $1788.8 high, at which point a daily evening star reversal pattern and several bearish divergences formed. In addition, the intra-day wave down from $1788.8 fulfilled its smaller than (0.618) at today’s $1722.0 swing low. This implies that after a brief upward correction gold should fall to $1696 before the move up eventually continues. Support at $1676 is expected to hold, though a close below this would call for a more substantial test of support before prices rally again.
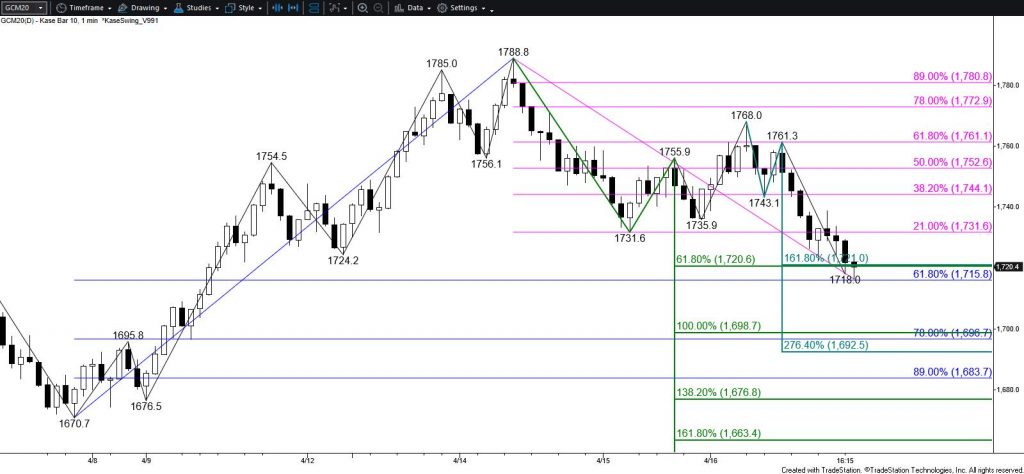
For now, resistance at $1748 is expected to hold and $1764 is key. Settling above $1764 would call for a move above the $1768 swing high. This would invalidate the wave down from $1788.8 that projects to $1696 and lower. This would also clear the way for the move up to extend to $1782 and likely $1796, the last threshold protecting $1800.
This is a brief analysis for the next day or so. Our weekly Metals Commentary and daily updates are much more detailed and thorough energy price forecasts that cover key COMEX precious metals futures contracts and LME Non-Ferrous (Base) metals, spot gold, the gold/silver ration, and gold ETFs. If you are interested in learning more, please sign up for a complimentary four-week trial.