Natural gas’ decline stalled at $2.567 on February 6. This was near the very crucial bearish decision point of $2.52. Subsequently prices have risen to $2.857. The market is likely settling into a range that is being supported by external factors (i.e. cold weather), but is searching for the upper end of this range.
A confirmed daily morning star and a few weak momentum signals (white arrows) on KaseX indicate the upward correction should extend. However, the correction met and held the 38 percent retracement from $3.299 to $2.567 at $2.85. In addition, KaseX has already generated a short warning (yellow down triangle), and prices are sitting just below the crucial $2.79 level. The $2.79 level has been major support for week, and it is now key resistance. It was tested one and held already on February 3, so a close over this would be positive for the near term.
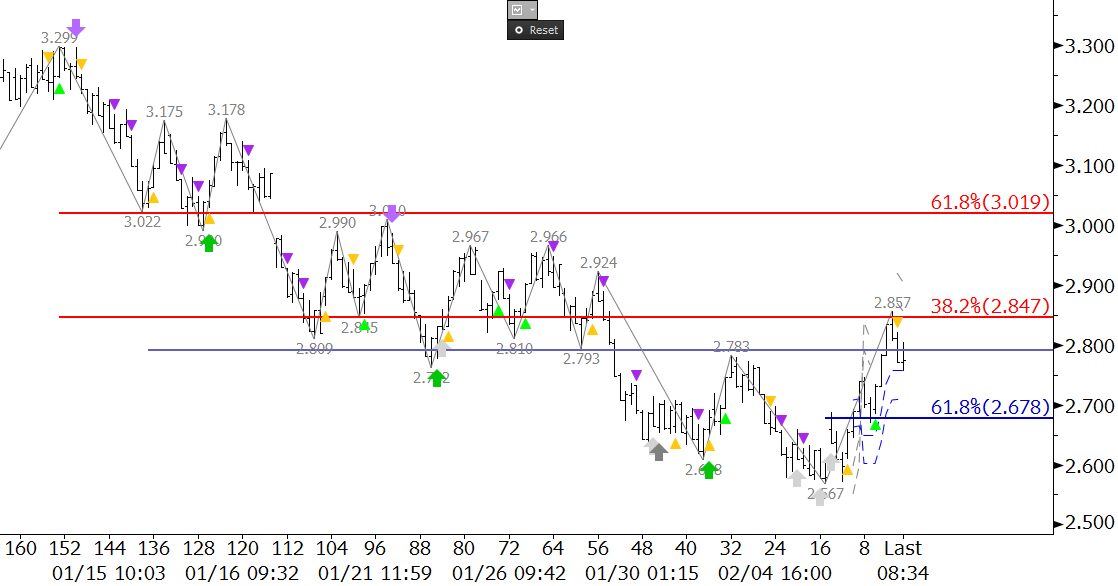
Overall, the charts and technical factors discussed indicate that traders are anticipating a bullish U.S. Energy Information Administration (EIA) Natural Gas Weekly Update tomorrow. However, there is some uncertainty to this move, which is why prices backed off the $2.857 swing high morning and are hovering around $2.79.
A close over $2.79 would open the way for $2.85 again, and likely $3.02, which is the 62 percent retracement from $3.299. The $3.02 level should hold unless tomorrow’s EIA number is much more bullish than anticipated. A close below $2.79 would call for $2.68 to be challenged. This is the 62 percent retracement from $2.567 to $2.857. A close below this would then call for another test of the $2.52 decision point.
Take a trial of Kase’s Award Winning Weekly Energy Forecasts.