Technical Patterns Still Call for ULSD Price Rise

NY Harbor ULSD May futures fell to 187.35 on Monday, but the decline is corrective and forms an intraday bullish pennant (not shown). Support at 182.7, the 38 percent retracement from 166.53 should hold, though an extended correction to the 62 percent retracement at 176.5 would not be out of the ordinary at this point. A close over 190.9, the 1.618 projection from 164.9 would confirm the short-term positive tone and call for a split target at 205.0. This is the 2.764 projection from 164.9 and the 1.00 target from the 155.66 low, and is the most likely stalling point.

ULSD

Take a trial of Kase’s weekly energy forecasts.

May natural gas futures stalled at $2.475 after meeting the 0.618 target for the wave $2.949 – 2.583 – 2.719. A close over $2.576 will complete the bullish morning star and a close over $2.624 would confirm it. In addition, the confirmed bullish KaseCD divergence and second class long KEES permissions indicate the upward correction should extend. A normal correction will hold the 38 percent retracement from $2.949 at $2.66. An extended correction is expected to hold $2.77, the 62 percent retracement.

Take a four-week trial of the Kase Commentary on Natural Gas.

natural gas prices

Since mid-March prices for the May RBOB Gasoline futures contract have oscillated in a narrowing range and formed a coil pattern. Coils are patterns that indicate market indecisiveness, which has definitely been the case for the entire crude oil infrastructure since the beginning of the year. Coils are not as reliable as flags, pennants, and wedges at predicting the direction of the breakout, coils do tend to break in the direction of the trend, in this case down.

RBOB Gasoline

On Monday, the upper trend line of the coil was tested and held. Prices fell at the end of the day, and the evening star setup that formed indicates a test of support and the lower trend line of the coil should be tested later this week.

A close below 172.7, the 0.618 projection of the wave down from 197.95 would open the way for at least 161.7 and possibly 150.7 as he 1.00 and 1.382 projections, respectively.

A close over 185.0 would indicate prices have broken higher out of the coil and call for another test of crucial resistance at 197.3, which is the 0.618 projection of the wave up from 152.34.

Learn more about Kase’s weekly energy forecasts.

Natural gas prices are still oscillating in the upward sloping range that began March 3 when the $2.641 swing low was made. The lower trend line of the formation, which connects back to the $2.589 contract low, was tested, but held again on Monday. Most pundits indicate the long-term fundamentals are bearish, but this begs the questions, why hasn’t the market broken lower yet? This is one of many areas that technical analysis can help answer that question and give us a good idea of where the market will go once it breaks out of this range.

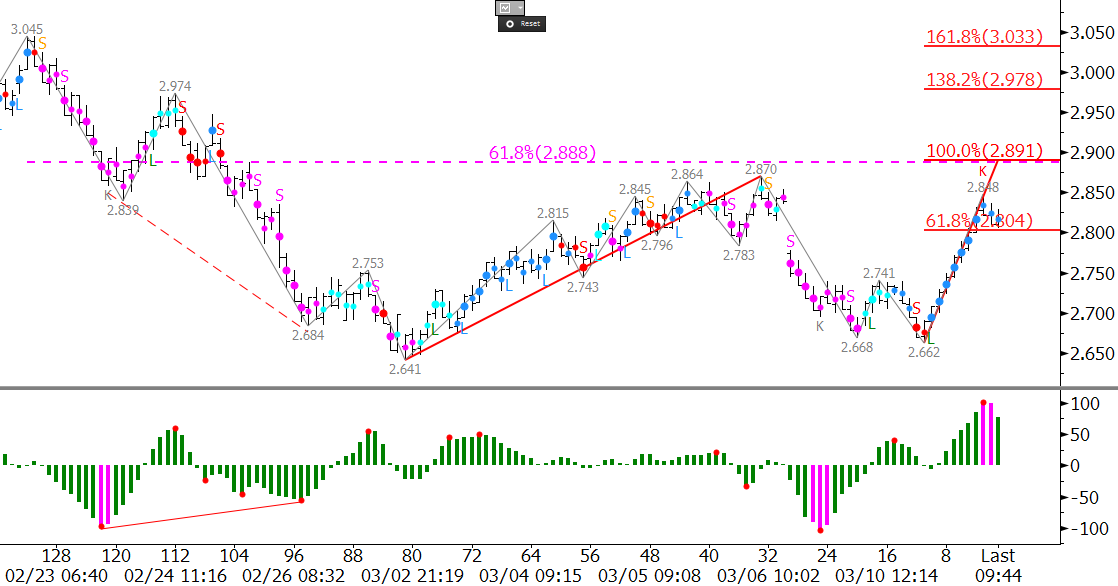
The chart below tells us everything we need to know about the outlook for natural gas in the near term, and can give us an idea about the longer-term outlook too. This is a very short-term analysis, so we will focus on those factors. Technical factors are showing that the market does agree with the bearish fundamentals, and that a break lower should take place soon, but that there are still enough positive factors like late winter weather in the Northeast to support prices for now.

Natural Gas Forecast

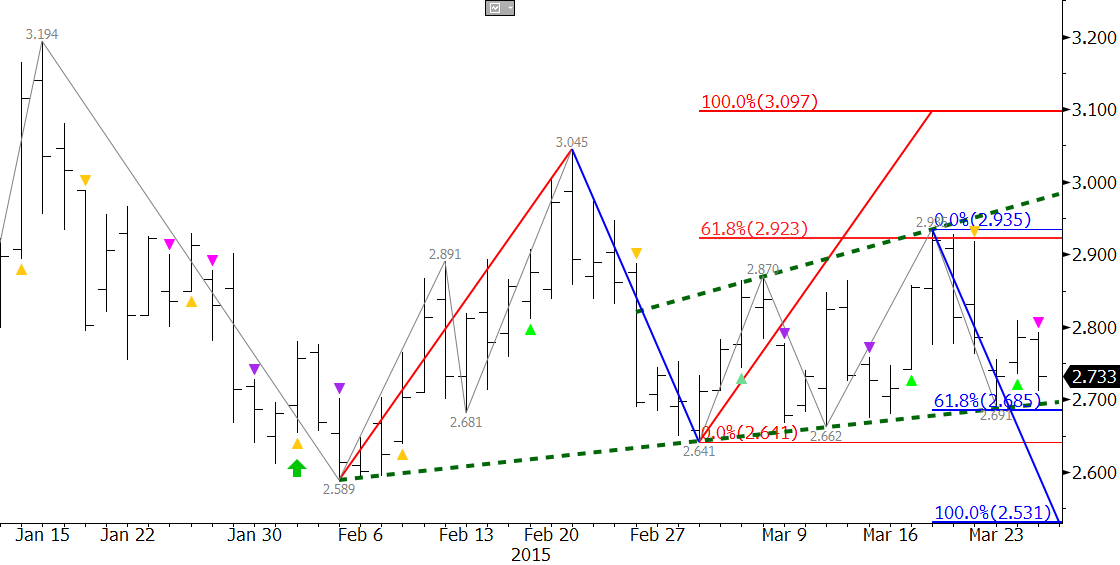
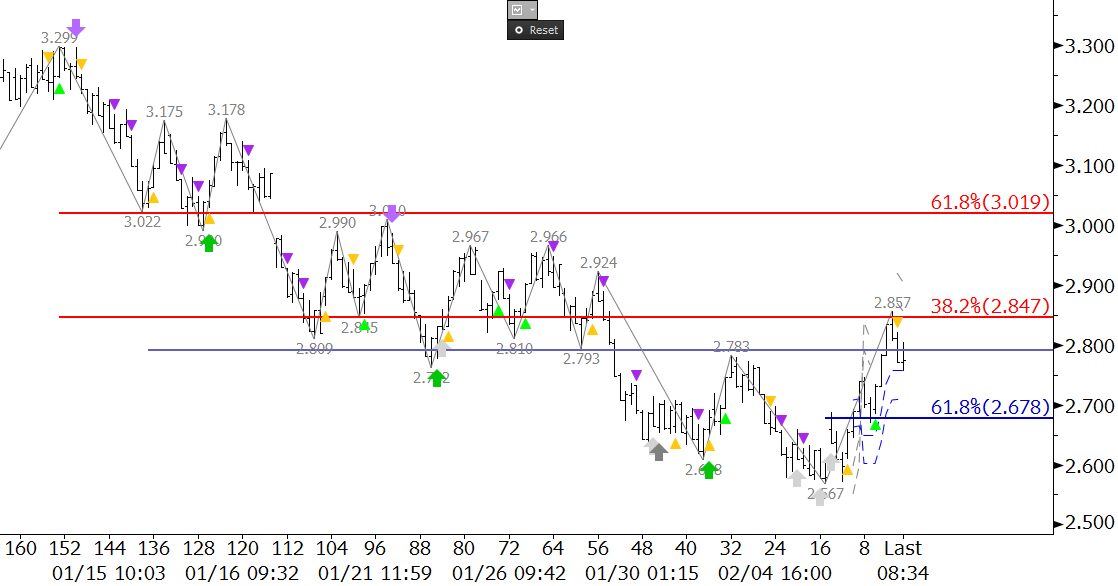
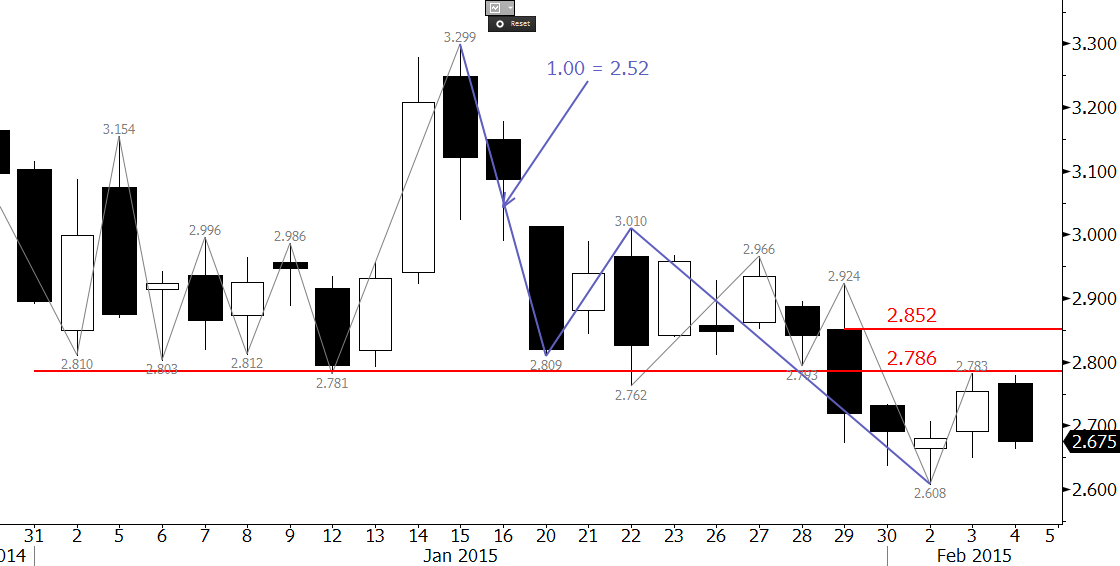
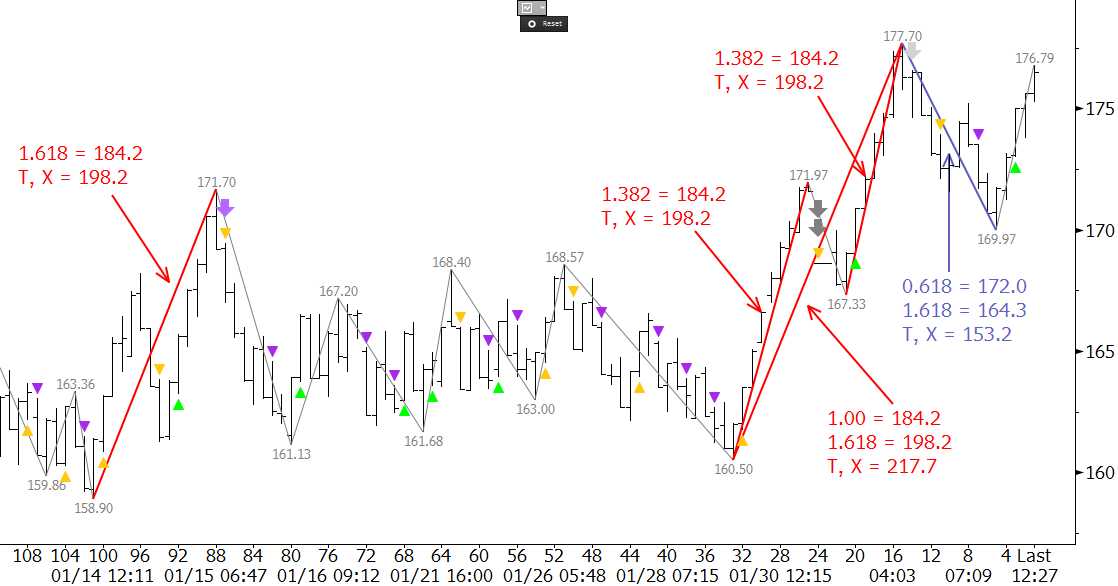
The range that has formed over the past few weeks is an expanding wedge (shown in green), and a break out of this pattern will solidify direction for natural gas prices. The break out points for the pattern at $2.69 and $2.94 are in line with the 0.618 projections for the wave up from $2.589 (show in in red) and down from $3.045 (shown in blue). The confluence of these points tells us that a close below $2.69 would open the way for the 1.00 projection of $2.53, and a close over $2.94 would call for an extended correction to $3.10.

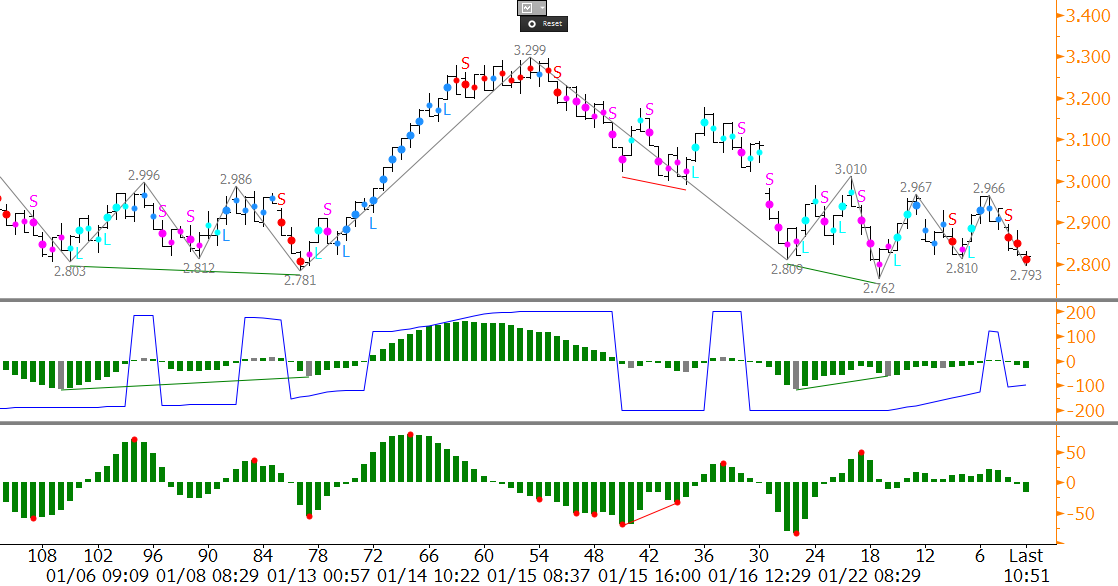
The expanding wedge and the Fibonacci wave projections give us a solid forecast once the market breaks out of the wedge. The wedge is a corrective pattern, and because the market entered the pattern after declining from $3.045, a break lower out of the wedge is favored. The negative bias is also confirmed by the KaseX’s most recent yellow and pink down triangles.

In summary, the near-term outlook is negative and a bearish U.S. Energy Information Administration (EIA) Natural Gas Weekly Update tomorrow would likely be the catalyst to achieve the expected break lower out of the expanding wedge. A close below $2.69 will confirm the break lower and call for at least $2.53. Conversely, a close over $2.94 would call for an extended correction to $3.10.

Take a trial of Kase’s in-depth weekly Natural Gas Forecast.

Take a trial of the KaseX trading indicator.

Natural gas prices are still oscillating in the corrective range between approximately $2.60 and $3.00. Early in the week it looked as though natural gas prices were ready to continue the decline. However, while there is little doubt that the long-term bias is negative, Wednesday’s price rise has called into questions how soon natural gas prices will fall to new contract lows.

Monday’s gap from $2.783 was filled early Wednesday and then April futures overcame the 0.618 projection at $2.80 for the wave up from $2.641. The $2.80 level was also near the 62 percent retracement of the decline from $2.87 to $2.662. The confluence of the wave projection and retracement at $2.80 makes it a crucial decision point for the near term outlook. Should natural gas prices close over $2.80, look for at least $2.89 because it is the 1.00 projection. This level is most important because it is also the 62 percent retracement from $3.045 to $2.641, the 0.618 projection for the wave up from $2.589 (not shown), and is in line with last weeks $2.87 swing high. A close over $2.89 would open the way for an extended correction and would further delay a decline to new contract lows.

natural gas prices

The first class long permissions (blue dots) for the Kase Easy Entry System (KEES) indicate the move up will likely continue, and that $2.89 should at least be tested tomorrow. However, the bearish KCDpeak (red K above 2.848) indicates the move up is already overbought on the 120-minute equivalent Kase Bar chart. A move above $2.848 would negate the KCDpeak, and as long as the KEES permissions remain long (blue dots) the near-term bias will remain positive.

Look for support at $2.73. A close below this over the next few days would shift the near-term bias back to negative and call for the $2.641 swing low to be challenged.

Learn more information about Kase’s energy price forecasts.
Learn more about KEES, which is part of Kase StatWare.

April gasoline prices fell for the fourth day in a row, but held support at 185.0. The bearish KaseCD divergence and underlying short permissions (red dots) indicate the decline should continue to 180.0. A normal correction will hold 180.0 because it is the 38 percent retracement of the move up from 149.64 and the 1.618 projection for the intraday wave down from 198.93 (not shown). A close below 180.0 would call for the 62 percent retracement at 168.5. This level must hold for gasoline prices to retain any chance at a continued recovery in the near term.

Learn more about Kase’s energy forecasts.

gasoline prices

Natural gas’ decline stalled at $2.567 on February 6. This was near the very crucial bearish decision point of $2.52. Subsequently prices have risen to $2.857. The market is likely settling into a range that is being supported by external factors (i.e. cold weather), but is searching for the upper end of this range.

A confirmed daily morning star and a few weak momentum signals (white arrows) on KaseX indicate the upward correction should extend. However, the correction met and held the 38 percent retracement from $3.299 to $2.567 at $2.85. In addition, KaseX has already generated a short warning (yellow down triangle), and prices are sitting just below the crucial $2.79 level. The $2.79 level has been major support for week, and it is now key resistance. It was tested one and held already on February 3, so a close over this would be positive for the near term.

Natural Gas Rise

Overall, the charts and technical factors discussed indicate that traders are anticipating a bullish U.S. Energy Information Administration (EIA) Natural Gas Weekly Update tomorrow. However, there is some uncertainty to this move, which is why prices backed off the $2.857 swing high morning and are hovering around $2.79.

A close over $2.79 would open the way for $2.85 again, and likely $3.02, which is the 62 percent retracement from $3.299. The $3.02 level should hold unless tomorrow’s EIA number is much more bullish than anticipated. A close below $2.79 would call for $2.68 to be challenged. This is the 62 percent retracement from $2.567 to $2.857. A close below this would then call for another test of the $2.52 decision point.

More information about KaseX.

Take a trial of Kase’s Award Winning Weekly Energy Forecasts.

For several weeks $2.79 was major support for natural gas. This level was tested many times, and was finally broken after last week’s bearish U.S. Energy Information Administration (EIA) Natural Gas Weekly Update.

Subsequently, prices have fallen to a $2.608 contract low, and $2.79 has become near-term resistance. The $2.79 level is the completion point for a bullish morning star setup, and was tested on Tuesday when prices rose to $2.783. This level is expected to hold for at least the next few days.

NGH5

As of this analysis, Wednesday’s decline has setup a pseudo bearish engulfing line. The bearish engulfing line and other technical factors indicate another bearish EIA number may be expected tomorrow.

Trading will likely be extremely choppy over the next few days, but look for $2.79 to hold and for prices to challenge the $2.608 swing low. Ultimately, the decline is expected to extend to the next major target and bearish decision point at $2.52.

Conversely, a close over $2.79 in the next few days would complete the bullish morning star setup and open the way for an extended correction to the $2.852 confirmation point.

For more information about Kase StatWare please visit the Trading Indicators Page. To take a free trial of Kase’s weekly energy forecasts please visit the Energy Price Forecasts Page.

NY Harbor ULSD future’s upward correction extended to 177.7 on Monday. The primary wave 158.9 – 171.7 – 160.5, met its 1.382 projection at 177.7 and is poised to extend to the 1.618 projection of 184.2. This is the decision point for an extended correction and potential recovery. Although it is too early to say that a bottom has been made, a sustained close over 184.2 would open the way for 198.7 and 217.7. A close below 164.3 would indicate the upward correction is complete and call for 153.2 and lower.

To learn more about Kase’s forecasts please visit the Energy Price Forecasts Page.

HO


Natural gas has positioned itself for a break out of the recent coiling pattern that began forming on January 20. March futures tested the crucial $2.79 area this morning, and most technical factors still favor continued decline. However, March’s inability to close below $2.79 is making this recent range look more like a short-term bottoming formation versus a corrective pattern. In addition, a bullish KasePO divergence and first class long permissions (blue dots) for the KEES indicator on the 240-minute equivalent Kase Bar chart indicate prices may attempt to rise above $3.01 again after tomorrow’s U.S. Energy Information Administration (EIA) Natural Gas Weekly Update.

NGH15

The key for a break higher will be a close over $2.97. This is the 0.618 projection for the wave $2.762 – 3.957 – 2.81. March already stalled at this level once, but overcoming $2.97 would open the way for $3.01, which then connects to $3.08 as the 1.382 projection. The $3.08 level is also near the top of the window that took place between January 16 and 20, so a close over this in coming days would be bullish for the near-term outlook.

That said, even though March has held $2.79 on a closing basis thus far, it has not been able to maintain momentum behind any recent price rise. If natural gas cannot break higher this week, the odds of an extended upward correction will quickly diminish. A close below $2.79 would then open the way for the next leg down, where the first target of that move is $2.71.