Midweek Natural Gas Forecast – July 22, 2015

Natural gas is idling in neutral again and is struggling to overcome key resistance levels. We are still negative for the longer-term, but the near term outlook is looking slightly positive.

The small move up is confirmed by long KaseX signals (green diamonds) on the $0.035 Kase Bar chart. In addition, Wednesday’s close over $2.895, the 1.00 projection for the wave up from $2.785, has opened the way for its 1.618 projection near $2.96. The $2.96 target is crucial because it is the 0.618 projection for the wave up from $2.644. A close over $2.96 would call for an extended correction to targets above $3.00.

natraul gas

Other than the quick move up from $2.644, the recent move up has lacked conviction. A daily evening star setup and hanging man indicates traders are still not quite sure if the market is ready to make the push higher. Tuesday’s $2.84 open is first support, and a close below this would call for another test of the $2.785 swing low.

This is a brief natural gas forecast ahead of tomorrow’s EIA report. Our weekly Natural Gas Commentary is a much more detailed and thorough analysis. If you are interested in learning more, please sign up for a complimentary four week trial.

August natural gas is attempting to rally above $3.00 after stalling at $2.644 last Thursday. The surge over the last week may be a desperate attempt to push prices to targets above $3.00 before summer’s end, and is being driven by speculation of above normal temperatures through the end of this month and into August.

The near-term outlook took a positive turn Wednesday when prices closed above $2.884, the 0.618 projection of the wave $2.588 – 2.977- 2.644. This clears the way for a rally to the 1.00 projection of $3.03. This is a potential stalling point for the upward correction. A close over $3.03 would call for the $3.20 confluence point with intermediate resistance at $3.11.

natural gas

Caution is warranted though because it is a bit early to get overly exuberant about a bullish recovery. The balance of bullish and bearish factors is razor thin and shifts day-to-day. The move up is almost certainly corrective of the longer-term decline. Do not be surprised to see prices pull back and settle below $2.82 on Thursday should there be a disappointing EIA storage report. This, in turn, would call for $2.75 and lower.

This is a brief natural gas forecast ahead of tomorrow’s EIA report. Our weekly Natural Gas Commentary is a much more detailed and thorough analysis. If you are interested in learning more, please sign up for a complimentary four week trial.

As predicted WTI crude oil has broken lower out of the recent trading range and fell by nearly eight percent on Monday. The important 1.382 projection was met at the $52.41 swing low. Key support at $50.5 should be tested tomorrow. We consider this a decision point for a much more bearish outlook and decline into the mid-$40’s. Today’s action may even dust up talks about the $30s again, though we think that conversation is a bit premature. Look for resistance at Monday’s $54.4 midpoint. This may be tested in early trading Tuesday, but should hold.

wti crude oil

This is a brief analysis and outlook for the near-term. Our weekly Crude Oil Commentary is a much more detailed and thorough energy price forecast. If you are interested, please sign up for a complimentary four week trial.

The RBOB gasoline crack spread widened to $25.64 on Monday and could test $27.77 before narrowing again. Resistance near this level is expected to hold and the crack is poised to narrow now that the 0.618 projection of the wave down from $33.80 was met. We would look to short the crack spread soon because KaseX generated a filtered sell signal on June 25th. The key target at $19.00 is the 1.00 projection and the top of the gap that took place on February 23rd.

crack spread

This is a brief analysis and outlook for the near-term. Our weekly Crude Oil Commentary is a much more detailed and thorough energy price forecast. If you are interested, please sign up for a complimentary four week trial.

Day-to-day speculation regarding summer weather forecasts continue to dominate short-term natural gas prices. The lack of clarity has caused natural gas to settle into a range between $2.55 and $2.95 after failing to close over the upper end of the range last week.

Technical factors show that prices are due for a test of the lower end of the range where contract lows will be challenged. Because the wave down from $2.955 (shown in red) met its 0.618 projection we expect to see at least its 1.00 projection of $2.62. This is also the 0.618 for the wave down from $3.105 (shown in blue).

natural gas prices

That said, it is still early for support to give way to the longer-term bearish trend, so the decline will likely be a grind. Support at $2.71 is holding strong, but a disappointing EIA storage report tomorrow would clear the way for $2.62. This is a confluence point just like $2.71, so $2.62 should hold.

Key resistance is $2.83 because it is in line with the $2.837 swing high. Overcoming $2.837 will take out the wave down from $2.955 and negate the near-term potential for $2.62.

This is a brief natural gas forecast ahead of tomorrow’s EIA report. Our weekly Natural Gas Commentary is a much more detailed and thorough analysis. If you are interested, please sign up for a complimentary four week trial.

Last week we discussed the chart below and the importance of $2.92 as the 0.618 projection of the wave up from $2.54 (not shown) and the 62 percent retracement from $3.15. The chart is being shown again, with a few updates, because not much has changed over the past week.

Natural Gas Projections

The crucial $2.92 level has been tested four times now, including this morning’s brief excursion to $2.955. Because prices failed to close over $2.92 again, we expect to see another oscillation lower to challenge support at $2.80. This is the 38 percent retracement of the move up and is near Monday’s $2.83 midpoint and Tuesday’s $2.831 low.

The bearish KaseCD and KasePO divergence and the DevStop2 hit on the $0.035 Kase Bar chart support the move lower and test of $2.80 tomorrow.

Natural Gas Divergences

Tomorrow’s EIA may be the catalyst the market needs to either close over $2.92 or below $2.80. A close over $2.92 has strong bullish implications as discussed in our weekly natural gas forecast. A close back below $2.80 would call for another test of support and possibly the contract lows. For now, $2.92 and $2.80 are the levels to watch for clarification of the near-term, and possibly the longer-term, direction.

This is a brief analysis ahead of tomorrow’s EIA report. Our weekly Natural Gas Commentary is a much more detailed and thorough analysis. If you are interested, please sign up for a complimentary four week trial.

This is an important time for natural gas because the market is moving out of the spring shoulder months and into summer. The market had been poised to test the contract lows, which it did, but the lows held and prices reversed higher this week.

The July natural gas futures contract closed above $2.78 resistance on Tuesday and was driven by warmer temperatures in much of the eastern half of the U.S. To sustain the move warm weather will need to persist and key resistance at $2.92 must be overcome on a sustained closing basis. The market tested $2.92 in early trading Wednesday, but this level has held on a closing basis so far.

natural gas forecast

The $2.92 target is the gateway for a sustained summer rally because it is currently the most confluent target on the chart and makes connections to targets near, and well above, July’s $3.15 swing high. It the 62 percent retracement from $3.15 and the 0.168 projection for the move up from $2.54. A close over $2.92 will call for July’s $3.15 swing high to be challenged because the 1.00 projection for the wave up from $2.54 is $3.166.

The $2.92 level will probably be overcome in early trading tomorrow on an intraday basis, but again, the key will be a sustained close over $2.92. In fact, if there is another bearish EIA storage report tomorrow, the move up could stall.

First support is near yesterday’s $2.77 candlestick midpoint and the 38 percent retracement of the move up from $2.556. If the outlook is going to remain positive for at least the next few weeks then $2.77 should hold. Key support is $2.70, the 62 percent retracement. A close below this would put the market back into a cycle of testing the contract lows again.

This is a brief analysis ahead of tomorrow’s EIA report. Our weekly Natural Gas Commentary is a much more detailed and thorough analysis. If you are interested, please sign up for a complimentary four week trial.

Natural gas’ pullback still appears to be corrective, but has positioned itself to test a crucial decision point at $2.71. This is in-line with the $2.711 swing low, the 1.618 projection of the wave down from $3.105, and the 61.8 percent retracement of the move up from $2.443.

natural gas

The $2.71 objective should be challenged ahead of tomorrow’s EIA report, which is confirmed by KaseX’s short signals on the $0.035 KaseBar chart today. The confluence, positioning, and importance of $2.71 leads us to believe that it will hold, at least initially, and will be followed by a trading range similar to the one seen throughout March.

This is a brief analysis ahead of tomorrow’s EIA report. Our weekly Natural Gas Commentary is a much more detailed and thorough natural gas forecast. If you are interested, please sign up for a complimentary four week trial.

After a good up month in April for the British Pound, some pundits are calling for weakness, and attributing this to the probability that post the UK’s May 7 election, formation of a coalition government is likely.

This virtual eventuality has been in the news for at least a couple of months. If it were so bearish, one would think it would have become a factor much sooner than six days before the election.

Despite the prospect of a coalition government, a coalition led by Cameron versus Miliband is not the same thing. The Economist endorsed Cameron notwithstanding some drawbacks, such as a possible alliance with anti-EU UKIP. It looks like his leadership, even so, would be better for the UK economically than one led by Miliband, whose cumulative redistributionist ideas could scare away high earners and entrepreneurs.

It’s been said that explanations are always after the fact. Let’s see what the British Pound/US Dollar is saying for itself.

The rise in value of the pound from April 13 to 29 has the characteristic of being driven by over exuberance. There are many opens that jumped higher than the previous day’s close, or if not, opened only a hair below. This looks like typical short-term emotionality.

The high of this move, 1.54969 failed to overcome that of more than two months earlier, 1.5512, so it’s not as if we’re talking about a major bull market here. Indeed all the bullish excitement has been about one up month, April. This overhyped month, though it had a reasonably large open-close range, failed to close over March’s open.

Technically charts show what’s called a piercing pattern, versus, an engulfing line. So though April “pierced” March’s armor, March was not engulfed. Clearly then this dampens April’s importance.

April was number 10 in a 10 month decline, and only the second to be an up month (the other was February). April made lows not seen since July 2010. The price low triggered a very mild oversold signal, but it’s not unusual for this to happen and be followed by a bit of a bounce.

Negating the importance of this is that overbought April, at least so far, has not been confirmed by and up closing May (again so far). The fact that May’s been down decreases the significance of the oversold signal, and even more so emphasizes a lack of disparity between negative momentum and negative trend.

The weekly is setting up a bearish pattern called a Harami star. A close below about 1.50, which is last week’s open-close midpoint, and the high for the week prior, would call for expectations to clearly look lower.

Indeed last week’s high was well above both its open and close. This means that prices tried very hard to climb up, fell right back down, in this case, to just below the where prices started the week.

Monthly and Weekly Candlesticks

GBPUSD

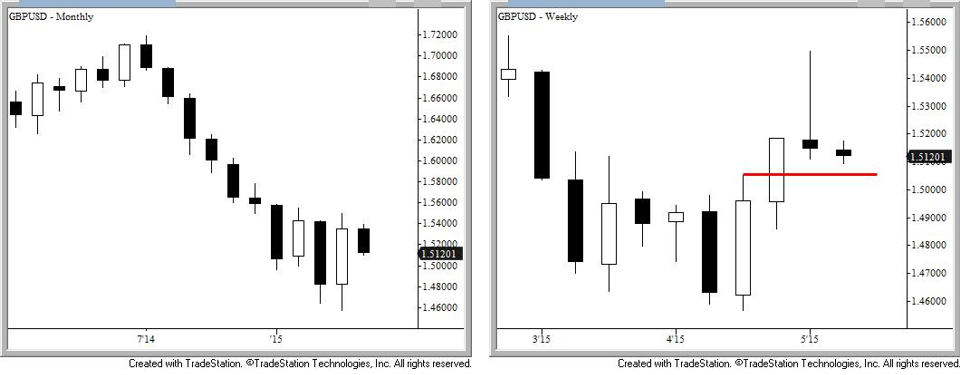
All markets have corrections, and often it’s expected that these will be of particular magnitudes. Here, another bearish factor is that the price decline smashed through the 38 percent retracement, and would now be expected to decline at least to about 1.503ish to meet next major retracement of 50 percent.

Bottom line is that the British Pound can’t tell us who will be the next Prime Minister, or whether a coalition must be formed, but it is telling us that it’s not feeling very well right now.

There have only been a few down days so far this month, and the down move may prove only corrective, but if we see a close below $1.50ish, then a retest of April’s low might become increasingly likely.

Charts created using TradeStation. ©TradeStation Technologies, Inc. 2001-2014. All rights reserved. No investment or trading advice, recommendation or opinions are being given or intended.

It is hard to deny the strength of the natural gas price rally over the past two weeks. Last week’s bullish engulfing line, April’s bullish hammer and morning star setup, and bullish daily divergences on the KasePO, KaseCD, MACD, RSI, and Stochastic are all technical evidence that the move down may finally be complete. However, many traders are skeptical of the move up and are asking what fundamental factors would support a recovery over the course of the longer-term. It is a fair and accurate question. Tomorrow’s U.S. Energy Information Administration (EIA) Natural Gas Weekly Update should provide a strong clue regarding the potential strength of a continued natural gas price rise.

In addition to the aforementioned bullish technical factors on the monthly, weekly, and daily charts, the short term technical factors and wave formations show evidence for a move to at least $2.93. This is a decision point because it is the 2.764 (XC – shown in red) projection for the wave up from $2.481, the 1.00 (E – shown in pink) from $2.557, and the 1.618 (L – shown in purple) from $2.747. In addition, $2.93 is the last level protecting mid-March’s $2.982 swing high. A sustained close over this would open the way for an extended move to targets above $3.00. However, $2.93 will not likely be tested until after tomorrow’s EIA report, if at all, because most traders are waiting for confirmation from another lower than expected build.

natural gas prices

There is good reason to be suspicious of this move up, and a disappointing EIA report tomorrow could be the catalyst to turn prices lower again in very short order. Therefore, until there is a sustained close over $2.93 caution is warranted.

The daily chart has formed a hanging man and evening star setup as of this mid-day analysis, and a close below Monday’s $2.78 midpoint would complete the pattern. This would then open the way for $2.65, the 50 percent retracement of the move up and last week’s midpoint. A close below $2.65 would confirm the move up is over and most likely point toward the market settling into a trading range while it sorts itself out.

Request a trial of our weekly energy forecast on natural gas to learn more.