U.S. 10 Year Treasury Targets 126’27

targetBy Dean Rogers

It has been a wild week on Wall Street and for markets around the world. Global equities have ridden a roller coaster in the U.S., Asia, and Europe, the U.S. Dollar strengthened a bit after a tumultuous decline, and oil is trying to find its bottom after a significant rally to $42.86 from our weekly commentary’s $37.9 target.

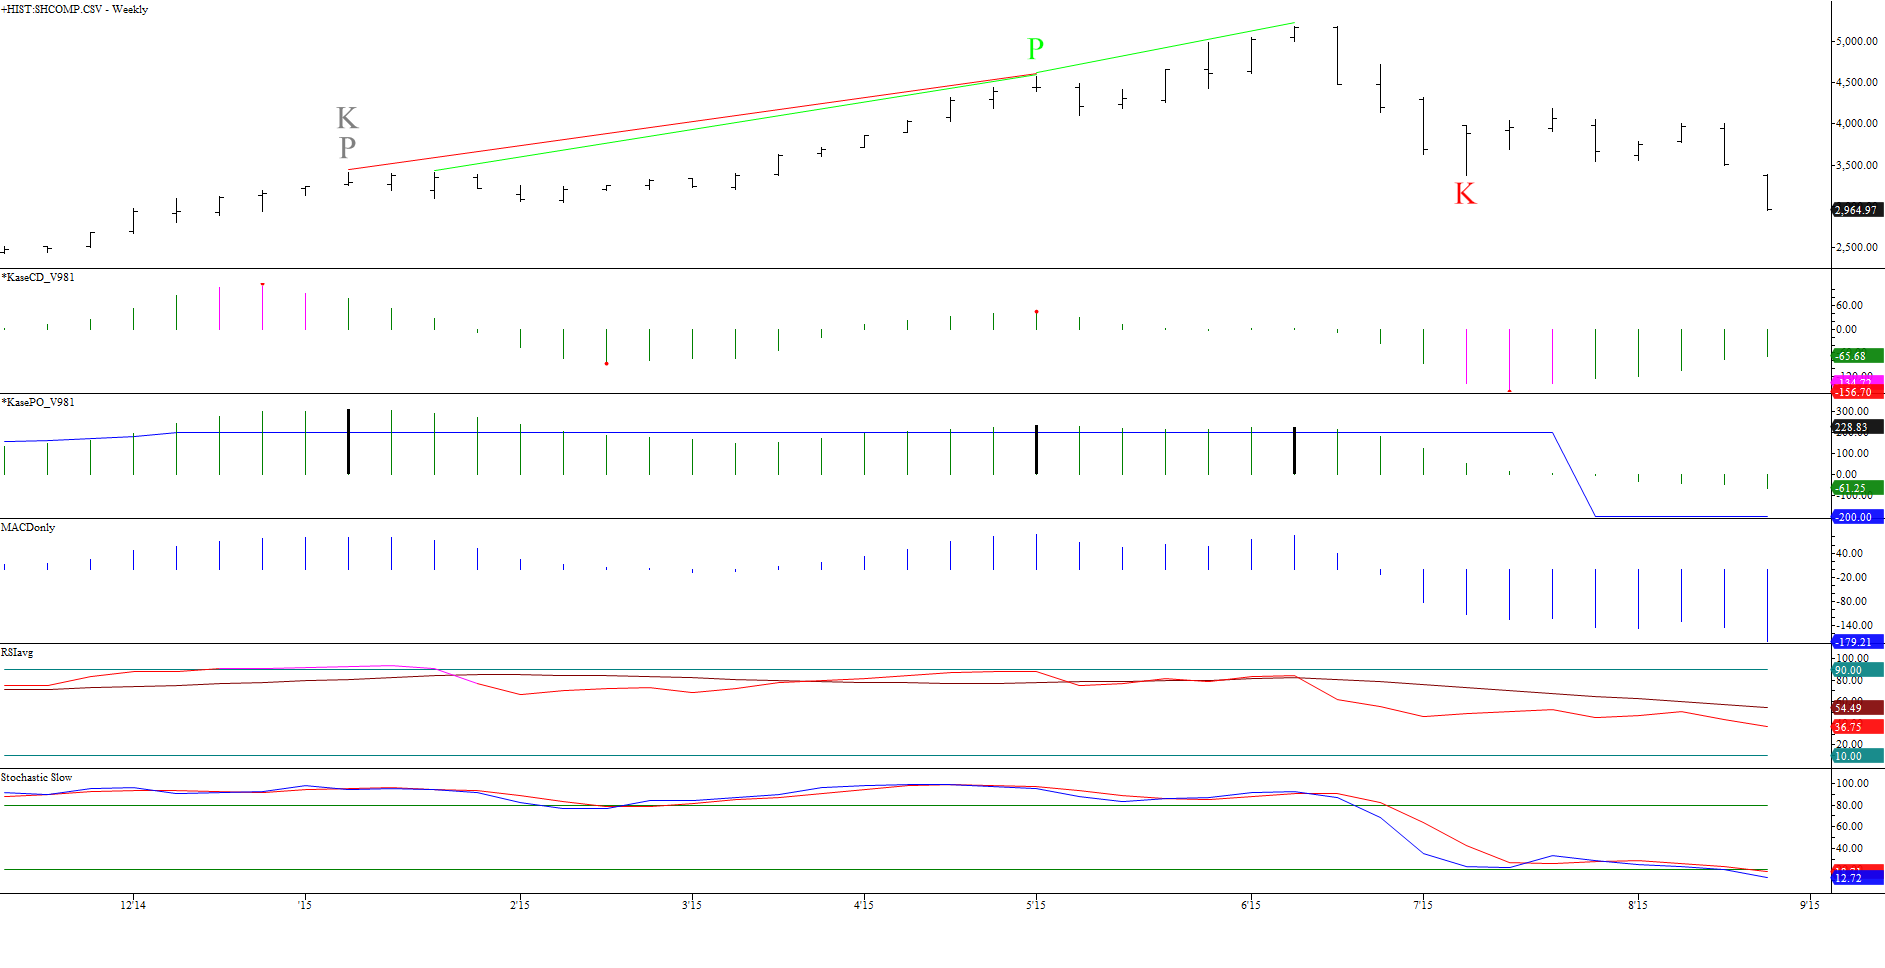
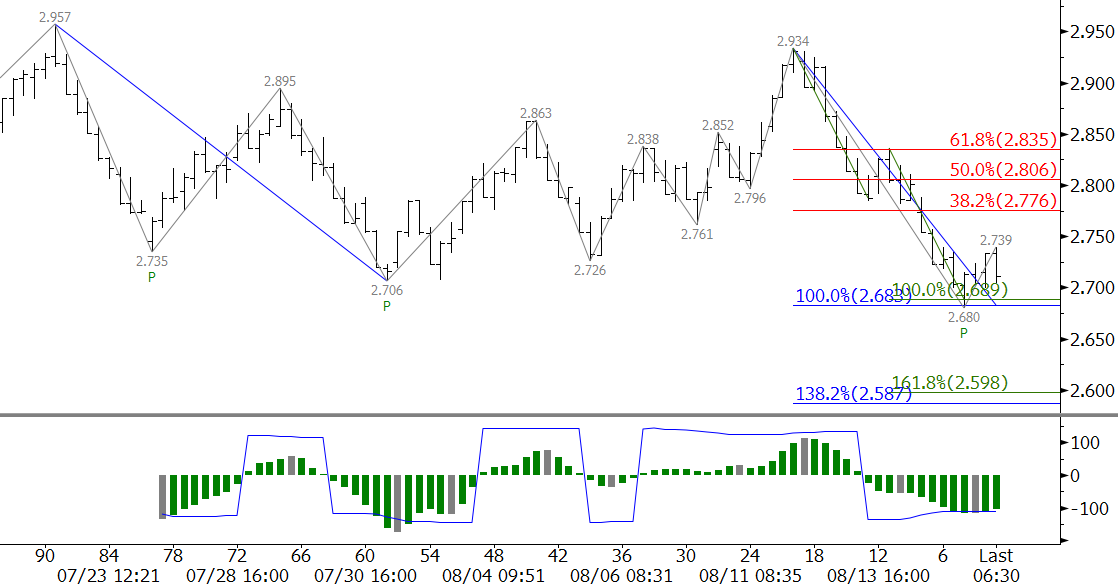
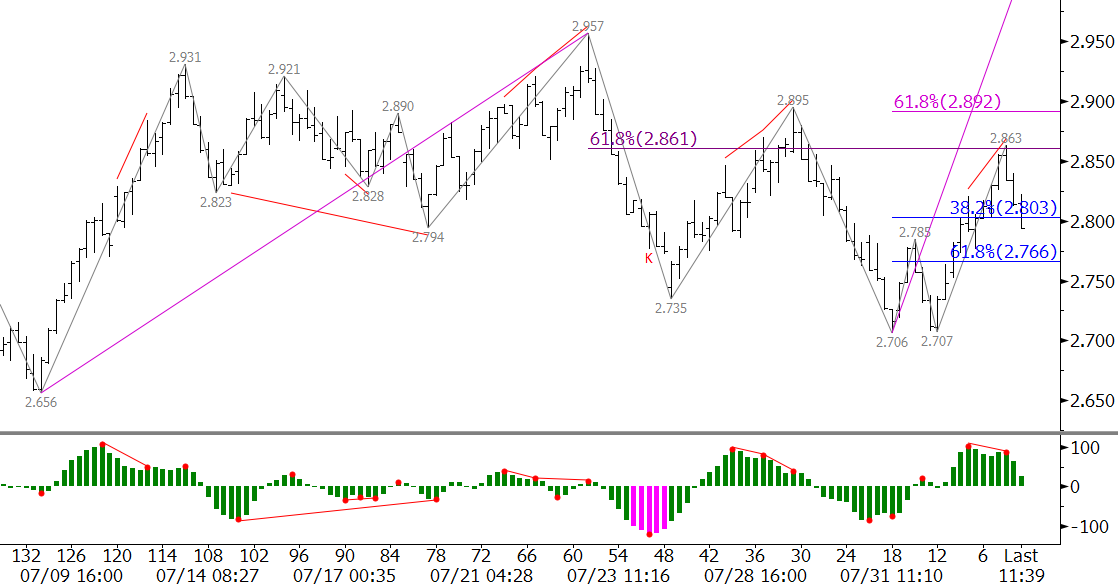
U.S. 10 Year Treasury bonds have come along for the ride and have fallen to 127’18 so far after stalling at 129’28. The 129’28 high was just above our June 30, 2015 projected resistance of 129’16.5. At this point, as shown in the chart below, bearish momentum divergences formed when rising price highs were accompanied by falling momentum highs on the KaseCD, MACD, and slow stochastic.

TY daily

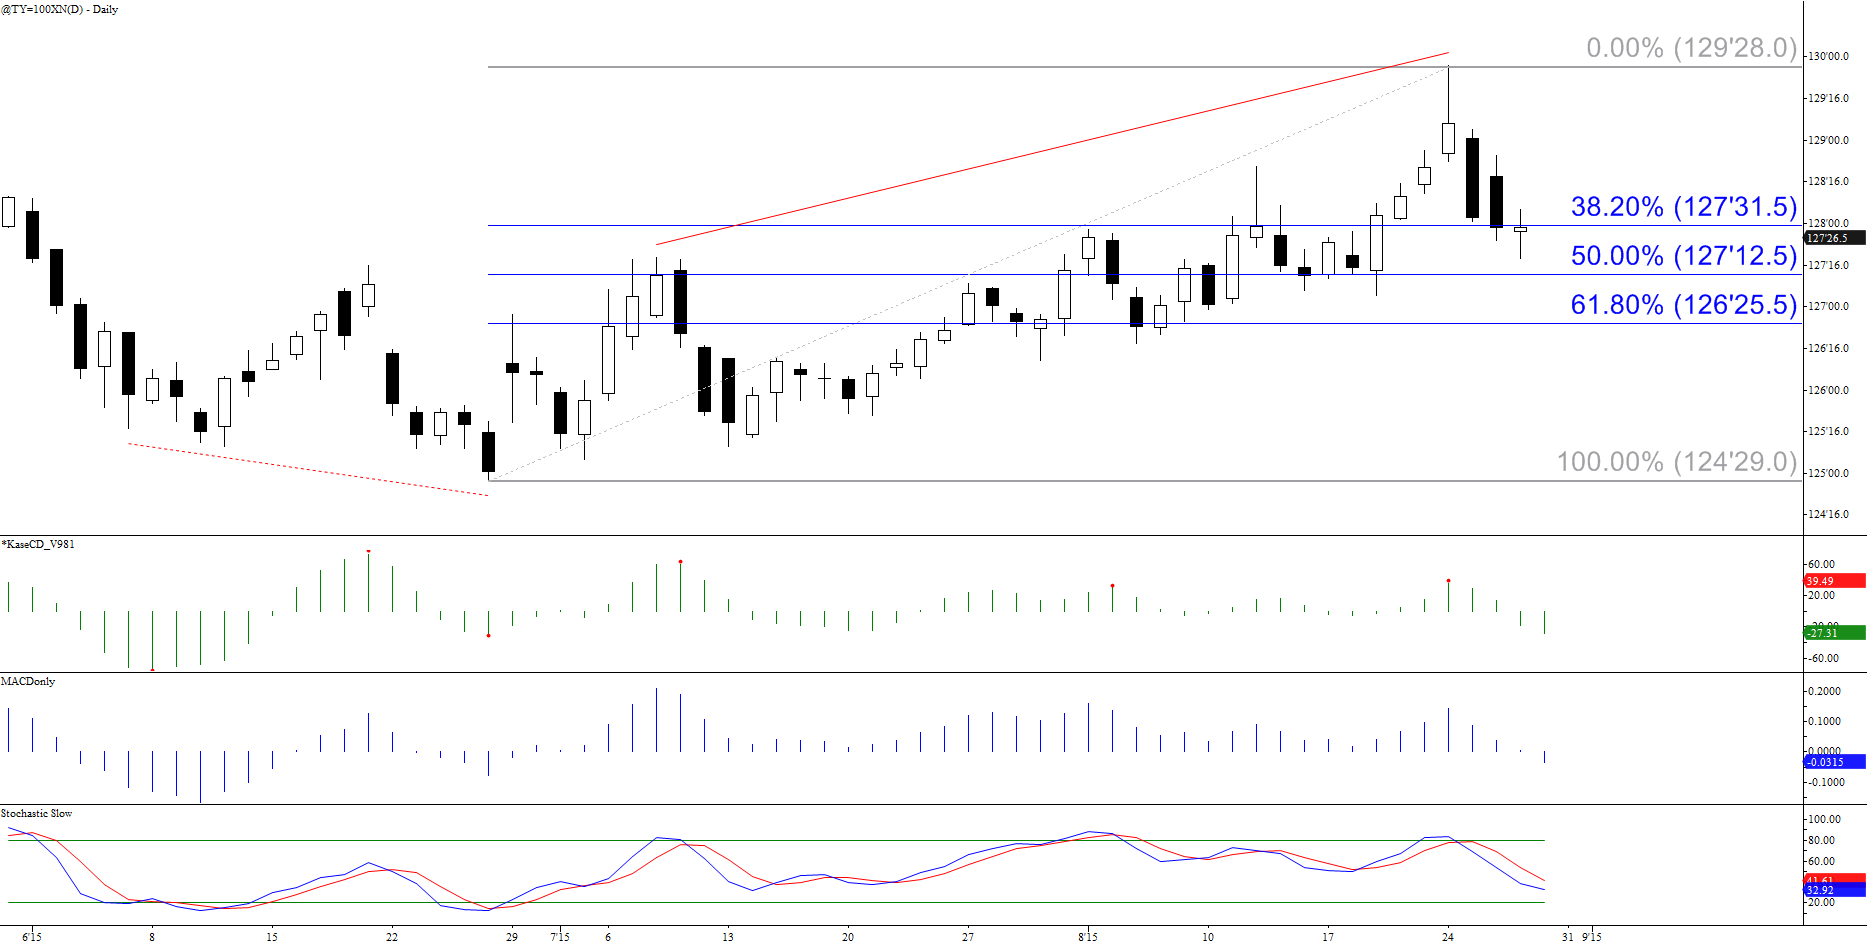
The divergences show that the decline will likely extend. However, there are several positive technical factors that indicate an upward correction should take place first.

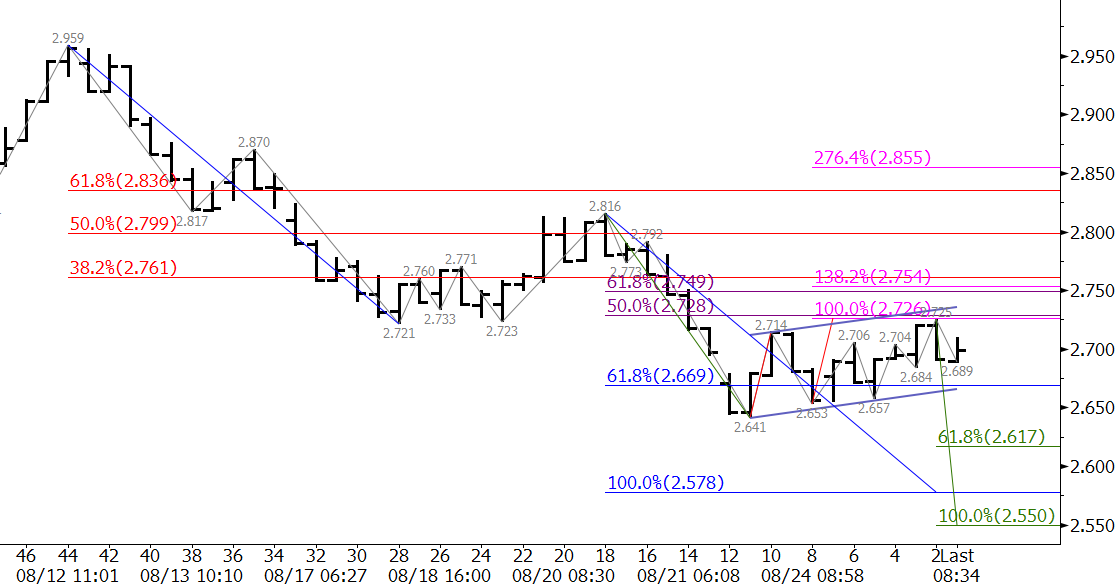
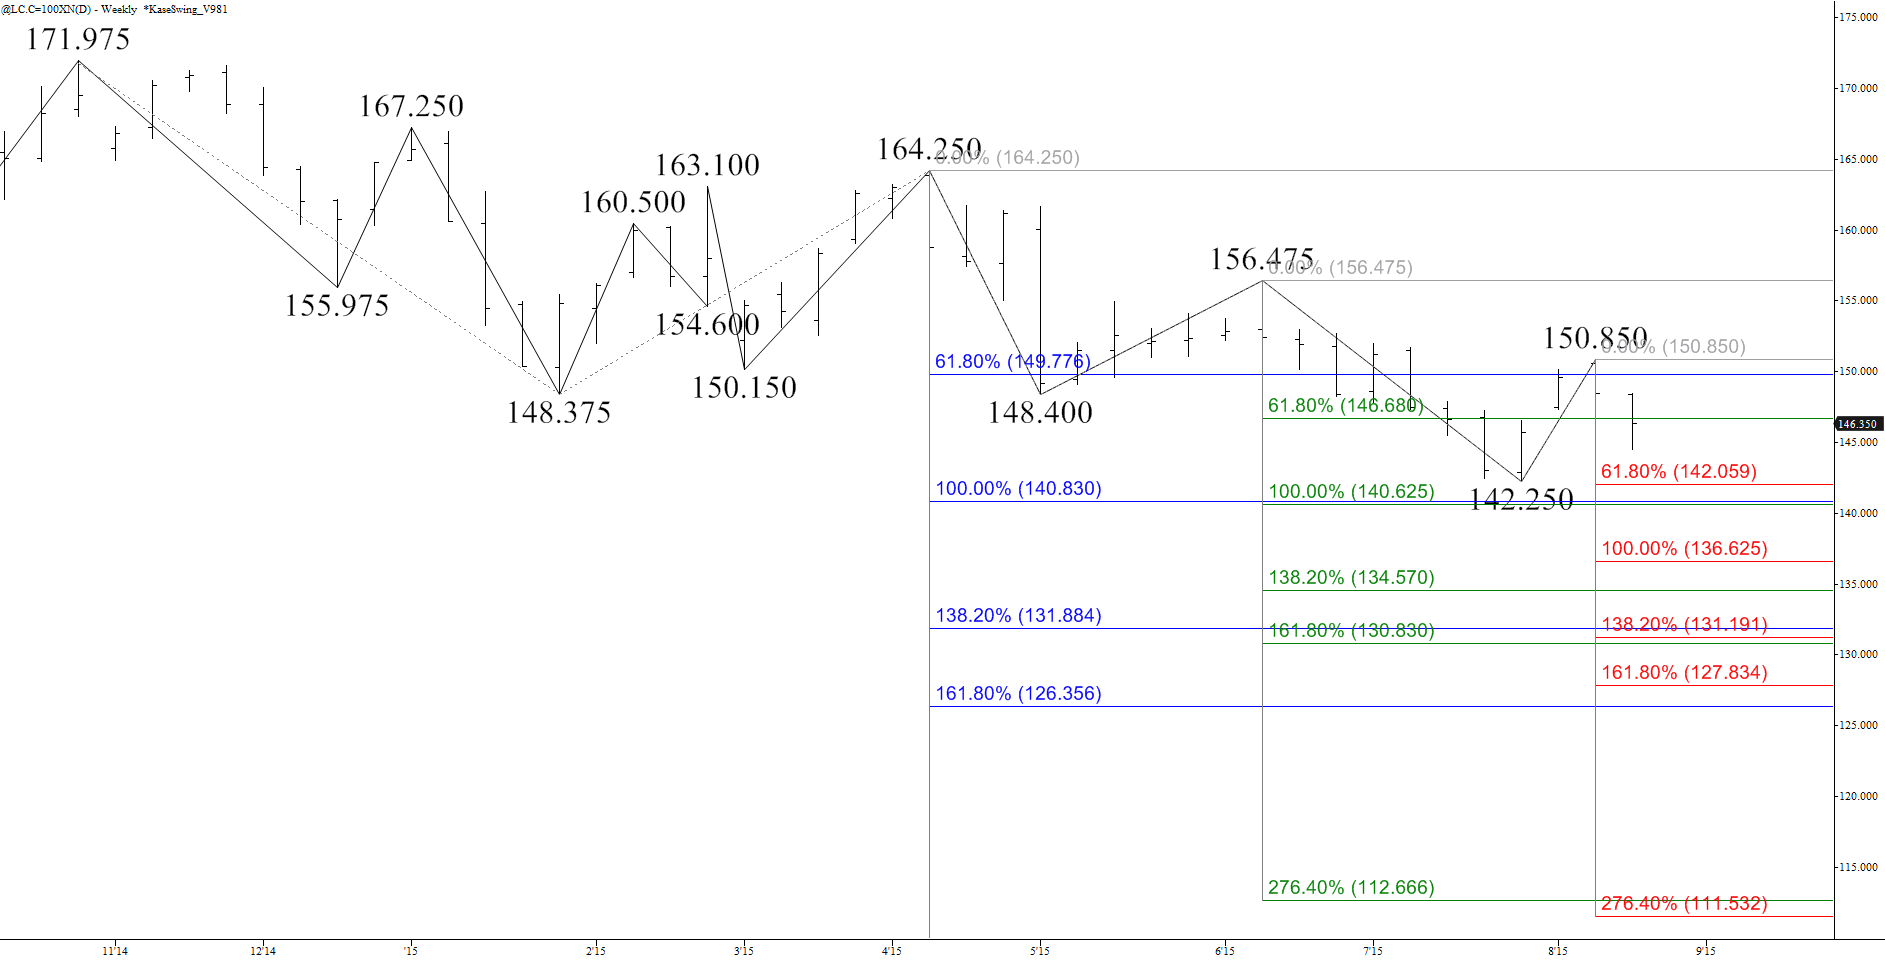
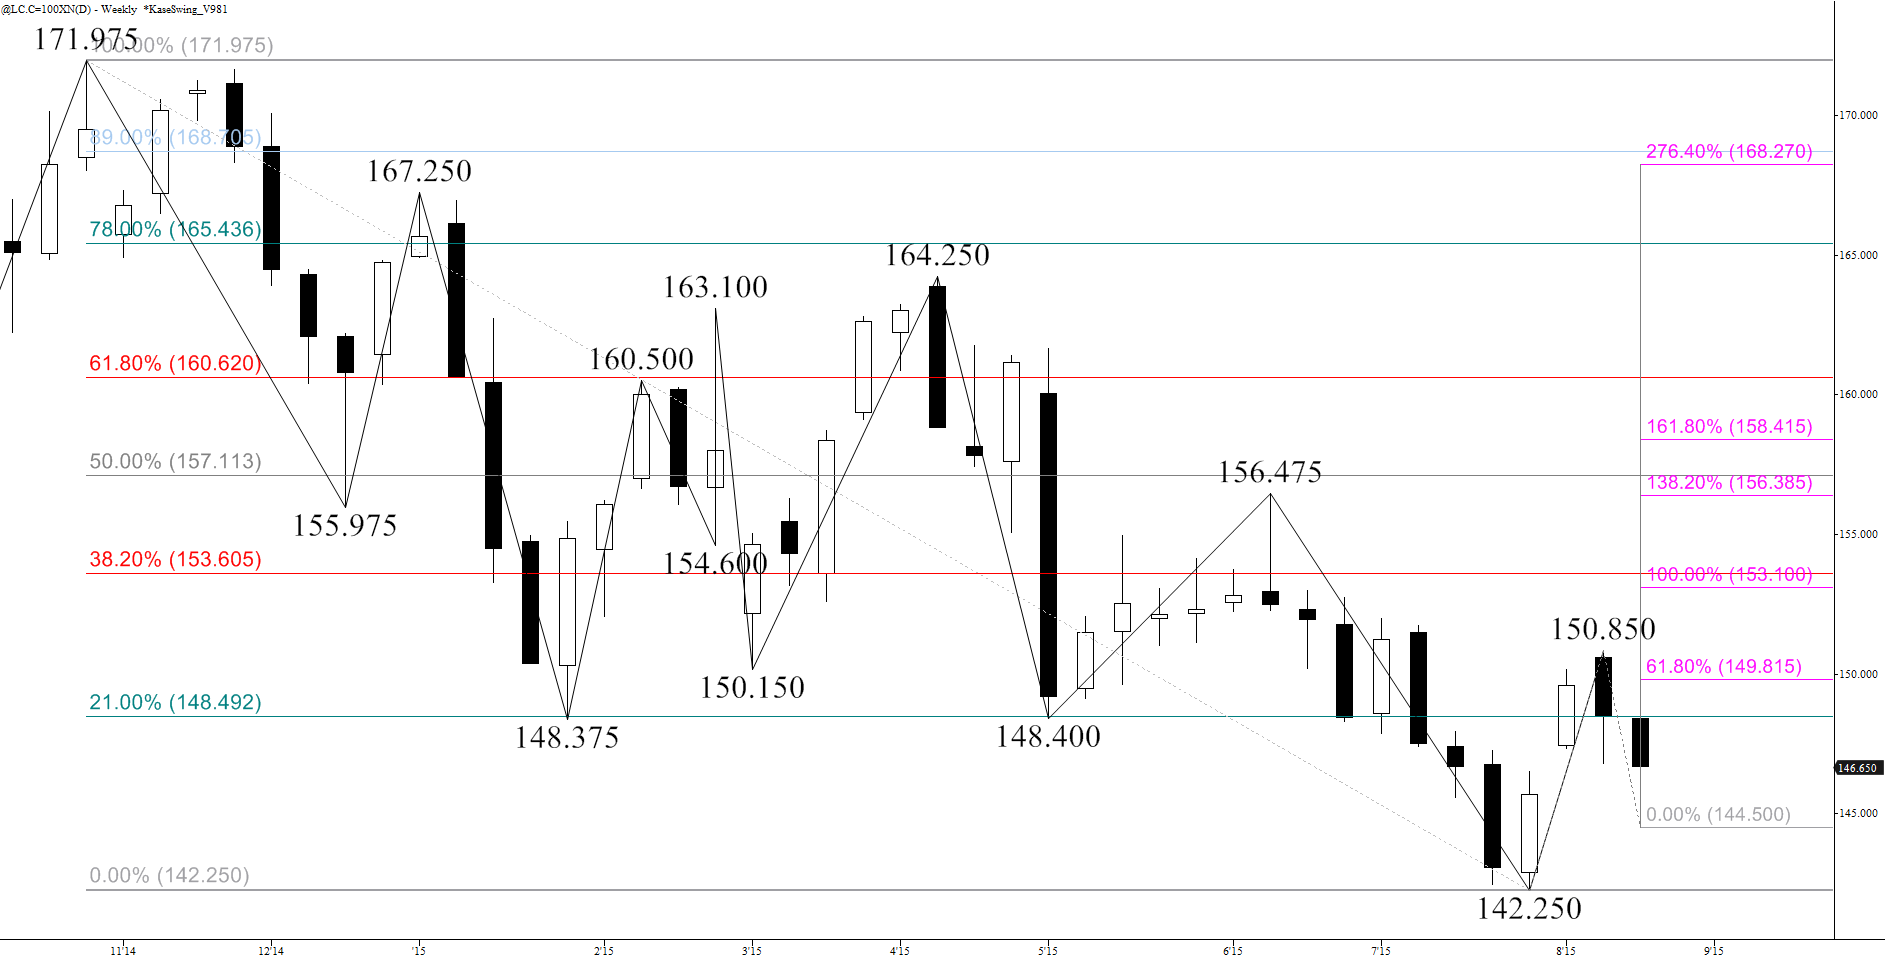
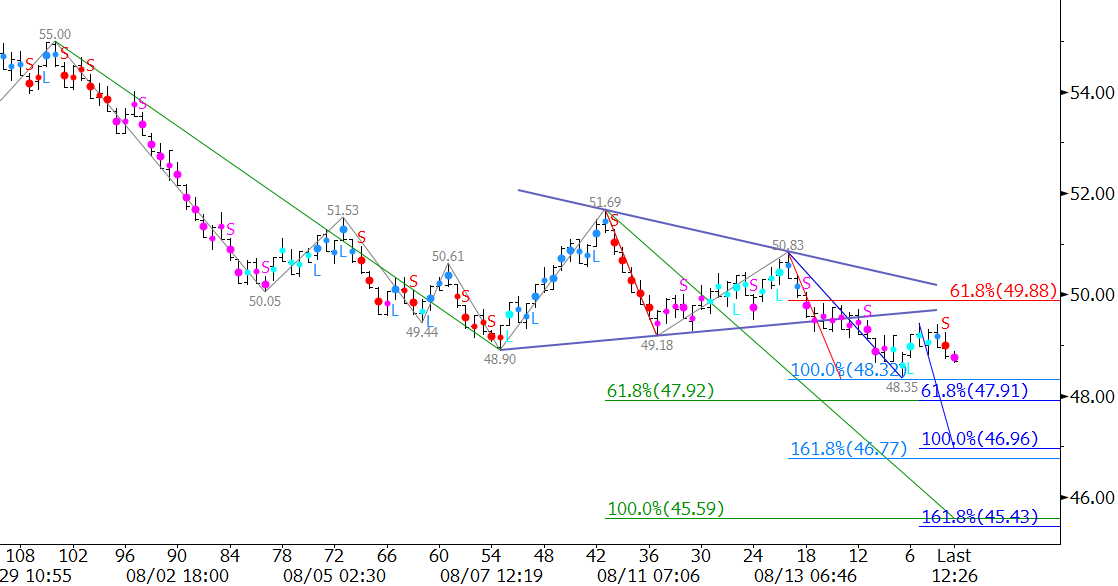
The daily candlestick chart above shows a morning star setup that formed on August 27. The confirmation point (open of August 26) is 128’18. This resistance level is also in line with the 38 percent retracement of the decline form 129’28 as shown in the chart below. Should the decline extend as expected over the next few days, 128’18 must hold. A close over this would call for 128’31.5, the 62 percent retracement.

TY weekly

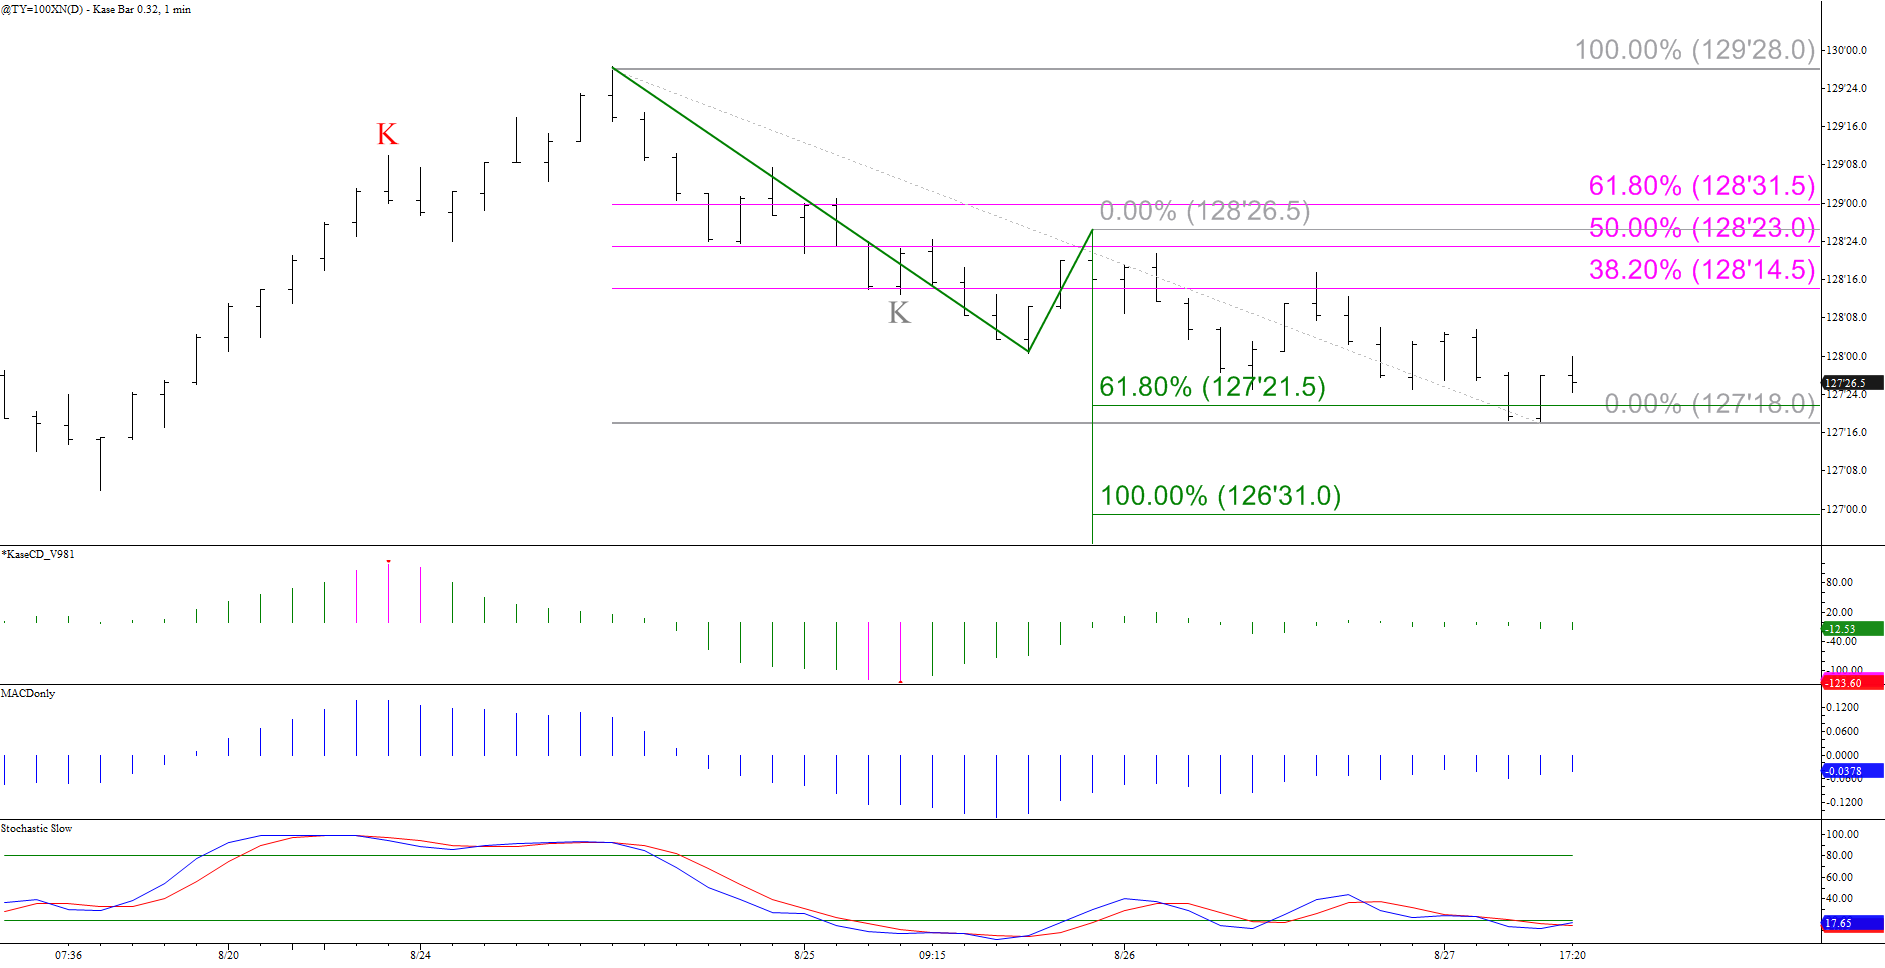
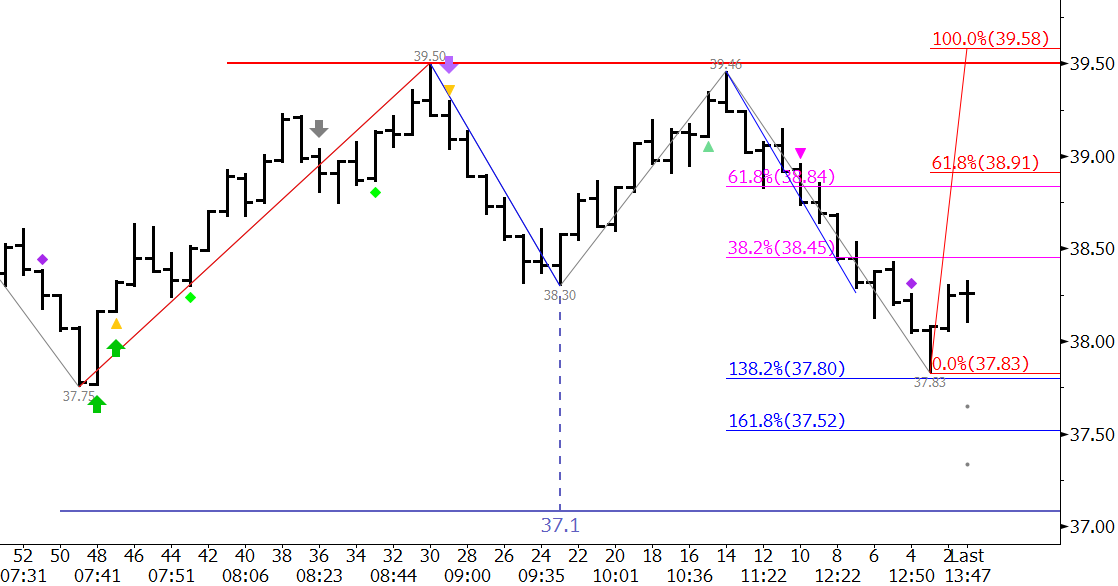
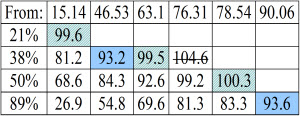
The wave formation down from 129’28, shown in green below, met the 0.618 projection at 127’18. Most waves (our studies show around 77 percent) that meet the 0.618 projection extend to at least the 1.00 projection, in this case 126’27. Therefore, odds favor at least 126’27. This is in line with the 62 percent retracement of the move up from 124’29 as shown in the daily chart (in blue). A close below 126’27 would call for 126’08 and 125’26.

In summary, for the near-term, these technical factors indicate U.S. 10 year treasuries should decline to at least 126’27, but that a small correction to 128’18 might take place first. The longer-term targets are discussed in our original article published June 30, 2015.

By Dean Rogers

Natural gas continues to hold the lower end of the trading range between $2.65 and $2.95 on a closing basis. October natural gas futures stalled at $2.641 and subsequently formed a bearish flag (blue trend lines). Flags are generally a reliable type of continuation pattern, which means the flag should break lower soon. The next targets are $2.62 and $2.55.

natural gas

A daily morning star setup (not shown) indicates the upward correction may extend. Resistance at $2.75 should hold. This is the 38 percent retracement from $2.959, the 62 percent retracement from $2.816, and the 1.382 projection of the wave up from $2.641. A close over $2.75 would confirm the morning star and call for an extended correction $2.80 and possibly $2.85.

Overall, our bias remains negative. Therefore, even if prices rose to test resistance we expect $2.75 to hold and for natural gas to continue its decline.

This is a brief natural gas forecast ahead of tomorrow’s EIA report. Our weekly Natural Gas Commentary is a much more detailed and thorough analysis. If you are interested in learning more, please sign up for a complimentary four week trial.

By Dean Rogers

Technical analysis provides traders and market analysts with extremely valuable tools that can help determine future support and resistance and major turning points. A good example of this came from our recent article Ask Kase: How to Trade the Shanghai Index that was published on June 9, 2015 by Cynthia A. Kase, CMT, MFTA. Ms. Kase’s analysis lead her to call for an overdue downward correction of the Shanghai Composite Index (SSE) once resistance at 5200 was met within a +/- 50 point tolerance. SSE rose to 5178.19 on June 12, before turning lower and eventually transitioning into the bearish collapse that has transpired over the past several weeks.

The market has blown through Ms. Kase’s lowest support level of 4550, below which she stated, “a much more sustained decline would commence”. She hit the nail on the head, and now, the techncials are showing us that SSE is poised for at least 2300 after a potential upward correction from 2947.94.

The decline from 5178.19 forms a very clear nested wave formation that has two primary waves: 5178.19 – 3373.54 – 4184.45 (blue) and 4184.45 – 3537.36 – 4006.34 (green). Both waves project to 2300 +/- 80 points. This is a very important target and potential bottom for SSE because it is the 1.00 projection for the wave down from 5178.19 (blue) and the 2.764 projection for the wave down from 4184.45 (green).

shanghai composite index waves

A sustained close below 2300 would call for a much more severe collapse to 2034, 1710, and possibly 1275.

As stated though, an upward correction might take place from 2947.94 before the decline continues. This is because both of the waves down from 5178.19 and 4184.45 met crucial projections around 3000. The 3000 level was also in line with the 62 percent retracement of the move up from the October 2008 swing low of 1664.93 to 5178.19.

To say the least, 3000 is important support, so a small correction to 3350, the 38 percent retracement of the decline form 4006.34 would be normal.

Retracements to 2947.94

shanghai composite index retracements

Key resistance for the near term is 3585, the 62 percent retracement from 4006.34 and the 50 percent retracement from 4184.45. A close over 3585 would open the way for 3755, the 62 percent retracement from 4184.45 and the 38 percent retracement from 5178.19. This is the level that must hold for the outlook to remain negative for at least the next few weeks.

A daily morning star setup (not shown) confirms that the upward correction might take place within the next few days. However, most momentum indicators show that a pullback will be nothing more than a temporary correction.

The weekly stochastic moved below 20 and is oversold, but it can remain there for weeks (or even months) before the index reverses significantly higher. All other momentum indicators, including the KaseCD and KasePO show declining momentum, which does not bode well for the formation of a bottom soon.

shanghai composite index weekly momentum

In summary, most technical factors are negative and odds favor a decline to at least 2300. A pullback from 2947.94 might take place first, but weekly and daily momentum indicators show that such a move will likely be corrective and should hold resistance at 3350 and no higher than 3585. Therefore, for now, buckle in for the rest of the ride lower.

Learn more about Kase’s trading indicators such as the KasePO and KaseCD, weekly crude oil and natural gas forecasts, and other services, at www.kaseco.com.

By Dean Rogers

On Friday evening I sat down to write Kase’s detailed weekly forecasts on WTI crude oil and Brent with an image of Chicken Little running around warning all of his pals that the sky is falling. This is a feeling that resonated with many market participants around the world as stock indices and commodities have plunged lower.

The reality is WTI and Brent will find a bottom soon, and there are logical/technical points at which these bottoms could form. From a technical standpoint, WTI crude oil is already well oversold and due for a correction. There are daily and weekly divergence setups on many momentum indicators, including our own KaseCD and KasePO, but this has been the case for weeks. Therefore, until a significant retracement takes place, reversal patterns form, and the daily and weekly momentum divergences are confirmed, the outlook will remain negative.

WTI met major support at $37.9 when it fell to $37.75 early Monday and settled at $38.24. Given today’s price action though, it looks as though the decline is going to continue to extend. WTI pulled back to $39.5 where an intraday double top formed, and the pattern was confirmed when prices fell below $38.3. The projection for the double top is $37.1. Look for at least $37.52, the 1.618 projection of the wave down from $39.5, and then $37.1 tomorrow.

crude oil

The small pullback from $37.83 may extend to $38.45 and even $38.88 first. The 38 percent retracement of the decline from $39.46 to $37.83 is $38.45 and the 62 percent retracement is $38.88. The latter is also the 0.618 projection of the wave up from $37.75 and is expected to hold. A close over this would call for an extended upward correction.

This is a brief analysis and outlook for the near-term. Our weekly Crude Oil Commentary is a much more detailed and thorough energy price forecast. If you are interested, please sign up for a complimentary four week trial.

Cows in a high mountain pastureBy Dean Rogers

Who could ever forget the iconic 1984 Wendy’s commercials featuring three little old ladies yelling “where’s the beef?”(If you are too young to remember treat yourself to taking a minute to watch.)

The commercials and the phrase “where’s the beef?” spawned a cultural catchphrase that has since become a statement questioning the value and substance of a product. The value of beef, priced in live cattle futures, has tripled since 1984, but a downturn in prices over the past 10 months begs the question, “where’s the beef going?”

On October 31, 2014 the perpetual (first nearby) live cattle futures contract rose to an all-time high of 171.975 cents per pound. Since then, prices have fallen in a corrective manner and recently came very close to meeting major support at 141.35. This is a highly confluent target that serves as a series of Fibonacci projections for the waves down from 171.975 (blue), 164.25 (green), and 156.475 (red) as shown in the chart below.

live cattle support

A close below 141.35 would open the way for the decline to continue to at least 135.6 and very likely 131.4. The latter is another highly confluent wave projection and potential stalling point, but the key target for live cattle futures is 127.0. This is the 1.618 projection of the largest and most important wave down from 171.975 (blue) and the more recent wave from 156.475 (red).

The decline from 171.975 is no doubt a correction of the long-term move up, and corrections normally hold the 1.618 target. Therefore, we expect to see a significant pullback and potential bottom form at 127.0. However, a sustained close below this would open the way for an extended decline to 122.05 and possibly 112.0.

The decline has stalled at 142.25 for now, and so far the subsequent rise to 150.85 is most likely a small correction of the move down (yes we are talking about corrections of corrections). The recent move up is most likely being driven by a typical seasonal boost for beef ahead of Labor Day.

The upward correction may extend, but 153.4, the 1.00 projection of the wave up from 142.25 (pink) and the 38 percent retracement of the decline from 171.975 should hold. The connection to 153.4 is made through the 0.618 projection of 149.8.

live cattle resistance

Based upon most technical factors as of this analysis, we don’t expect to see prices rise much higher than 153.4. This is a very important level not only because it is a confluent retracement and wave projection, but it also protects the 156.475 swing high. A move above 156.475 would take out of the waves down from this swing high and from 164.25. As a result the likelihood of a decline to or below 141.35 would be significantly dampened.

Therefore, upon a close over 153.4 odds would shift in favor of an extended upward correction to 156.8 and likely 159.5, a crucial target because it is split between the 1.618 projection of the wave up from 142.25 and the 62 percent retracement of the decline from 171.975. A sustained close over 159.5 would indicate the decline from 171.975 is over and would call for 168.5 and higher.

So to answer the question “where’s the beef going?”; technical factors show that prices will most likely fall once the Labor Day demand boost passes. Look for resistance at 153.4 to hold and for 141.35 to be challenged again. A close below 141.35 will call for 135.6, 131.4, and 127.0.

Check out Kase on Technical Analysis to learn more about trading and forecasting price using technical analysis.

Charts created using TradeStation. ©TradeStation Technologies, Inc. 2001-2015. All rights reserved. No investment or trading advice, recommendation or opinions are being given or intended.

By Dean Rogers

For most of 2015 natural gas has traded within a range between $2.65 and $2.95, and within the past week prices have tested both the upper and lower boundaries of the range. After failing to overcome $2.95 and stalling at $2.934 on August 12, prices declined to $2.68 on August 18, a confluent target for the waves down from $2.957 and $2.934.

Technical and fundamental factors favor a continued decline below the $2.65 boundary of the range to at least $2.60. This is another confluent target and a close below $2.60 would confirm the break lower out of the trading range.

natural gas

Wednesday’s bullish Harami land and star setup indicates that the upward correction from $2.68 might extend to $2.776 and possibly $2.834 first. These are the 38 and 62 percent retracement of the move down from $2.934. Resistance at $2.776 should hold, but $2.834 is the threshold for another attempt to overcome $2.95.

Overall, the bias is negative. The move down may be a grind lower for now, but time is running short for summer weather to continue to support prices above $2.65. Last week’s push to $2.934 may have been the last hurrah, and the move down is now poised to continue.

This is a brief natural gas forecast ahead of tomorrow’s EIA report. Our weekly Natural Gas Commentary is a much more detailed and thorough analysis. If you are interested in learning more, please sign up for a complimentary four week trial.

disney
By Cynthia Kase

Read on TraderPlanet.com

“Ask Kase” and your question may be chosen as the subject of a future column (askkase@kaseco.com).

The media sector has been hit by fears about streaming video and unbundling. Disney reported decent revenues, but is trading at a relatively high multiple. With high hopes that Star Wars will boost Disney’s stock price, is the decline now a time to buy in?

Disney climbed from a $15.14 low back in 2009 to a $122.08 high on August 4, only to suffer an $11 plus down gap on the following day’s open. This precipitous drop, continuing to $104.24, disconnected the following price action from the previous uptrend. Though the dropped seemed large, it only retraced 38 percent of the rise from $78.54.

Aside from waves, the only key pattern is an intraday coil, shown in the chart below (dark red). Though coils are signs of uncertainty, this one appears to be a failed attempt to recover. The last wave up in green would be expected to exceed the earlier one, which did not happen

$0.75 Kase Bar with Coil

DIS Kase Bar Chart

Charts created using TradeStation. ©TradeStation Technologies, Inc. 2001-2015. All rights reserved. No investment or trading advice, recommendation or opinions are being given or intended.

If there’s a break higher, though, I’d buy above $111 and increase my position above $117.9. Otherwise, I’d watch $100. If it doesn’t break, then I would time in on signals as prices rise from a short-lived downside test. I would buy on a bounce up from $93.4. But if this lower “drop dead” support breaks, I’d watch Fantasia instead of DIS for now.

Here are the details. As the coil’s apex is approached, a breakout is expected, with upside and downside targets $117.9 and $97.8 respectively.

The decline stalled before hitting its 21 percent retracement, $100. This is a hugely important price because it is the first retracement of the entire move up.

Retracements to $122.08

DIS Retracements

$100 is also a key extension for the waves marked in magenta in the chart. The wave from $122.08 extends to $100 as its 0.62 projection, and the Phi corrective projection. The 1.62 extension for this wave is $93.4.

The magenta wave down from $111 extends to $100 as its 1.38 projection. The last small wave from $109.28 targets $100 as its 2*1.38 extension. (For more on wave targets, check out Kase on Technical Analysis).

The waves shown in blue calculate to immediate support at $101.5. This is also Kase DevStop3 on the weekly chart. If this level isn’t broken on a move lower, then the tone will improve. It’s likely though, if this is tested, $100 will be met. $100 is also a psychological barrier.

Below $100, there’s a wave projection to $97.6, the coil’s lower target, but a break of $100 will likely lead to the $93.4 confluence point.

On the upside, the recent $111 swing poses initial resistance both structurally and as a wave target. Above this there’s a confluence point at $114.9, but the big number is $117.9, coincident with the coil’s upper target. Above this, a resumption of the uptrend would be expected, with reasonably confluent targets up to about $133.

Send questions for next week to askkase@kaseco.com, and learn more about Kase’s services please visit here.

By Dean Rogers

The world’s supply of crude oil continues to outpace demand, and consequently the global supply glut is being forecast through 2016. WTI fell to its lowest level in over six years last week and Brent is inching its way closer to testing the $45.19 low made on January 13, 2015. A move below this would be the lowest price at which Brent has traded at in over six years.

Structurally, the market is overdue for a correction and Brent’s daily morning star setup, a bullish candlestick pattern, warns that such a correction might take place soon. The decline’s momentum is also weakening, and there are daily and weekly divergence setups for Brent.

Brent and products attempted to stabilize and even rise in a corrective manner last week, but the move stalled. On Friday Brent crude broke lower out of the intraday coil shown below on the $0.50 Kase Bar chart.

brent crude

The break lower out of the coil indicates the decline should continue. The waves projections down from $55.0 (green), $51.69 (light blue), and $50.83 (blue) call for at least $47.9. This is a confluent wave projection that connects to $46.9 and finally $45.5.

The move down is becoming a grind, but until Brent crude can close over at least $49.9, look for the move down to extend. A close over $49.9 would at least create the potential for an extended upward correction.

This is a brief analysis and outlook for the near-term. Our weekly Crude Oil Commentary is a much more detailed and thorough energy price forecast. If you are interested, please sign up for a complimentary four week trial.

By Dean Rogers

Patience is a virtue.

Natural gas has been trying the patience of traders as it continues to trade in a range between approximately $2.65 and $2.95. This week’s rise from $2.706 is very similar to last week’s move up from $2.735, and given today’s decline and close below $2.80, it looks like another failure to overcome key resistance at $2.89 is taking place…again!

September futures stalled at $2.863, the 62 percent retracement from $2.957 to $2.706. This is also just below $2.892, the 0.618 projection of the wave up from $2.656. The retracements and projections confirm that $2.89 is a key level. A close over this would call for an attempt to overcome $2.95 and break out of the trading range.

natural gas

However, the bearish KaseCD divergence and close below $2.80, the 38 percent retracement from $2.706 to $2.863, indicates prices are now positioned to challenge support at $2.77, the 62 percent retracement. A close below $2.77 would then open the way for another attempt of $2.65 and lower.

The take away this week – be patient.

This is a brief natural gas forecast ahead of tomorrow’s EIA report. Our weekly Natural Gas Commentary is a much more detailed and thorough analysis. If you are interested in learning more, please sign up for a complimentary four week trial.

By Dean Rogers

RBOB Gasoline futures tested support at 167.43 on Monday and have taken out the crucial 169.25 swing low. The outlook is negative, but many technical factors, including Monday’s dip below the lower Bollinger Band, indicate a correction should take place once 160.0 is met. This is the confluence point between the 62 percent retracement of the move up from 122.65 and the 1.618 projection for the primary wave down from 218.58.

gasoline

Look for resistance at 172.3 and 181.3. The latter is expected to hold.

This is a brief analysis and outlook for the near-term. Our weekly Crude Oil Commentary is a much more detailed and thorough energy price forecast. If you are interested, please sign up for a complimentary four week trial.