Natural Gas Price Forecast – May 5, 2021

Natural Gas Technical Analysis and Near-Term Outlook

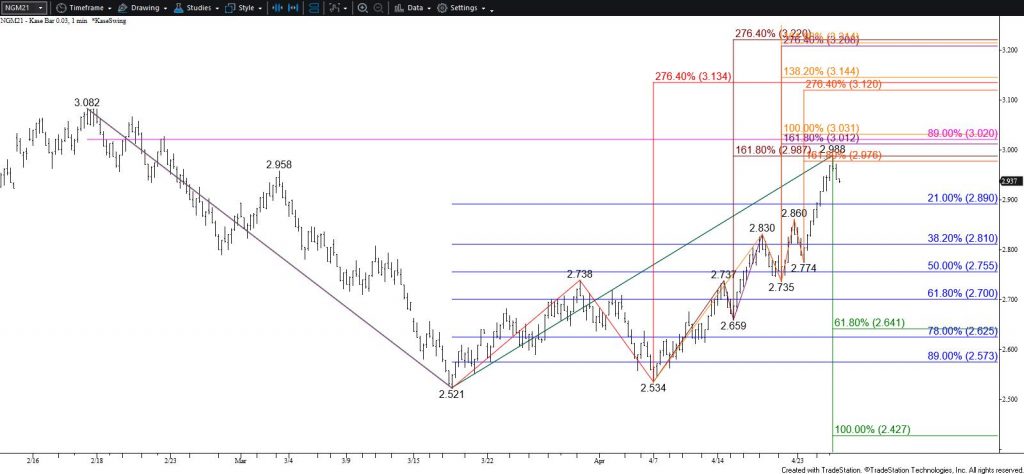
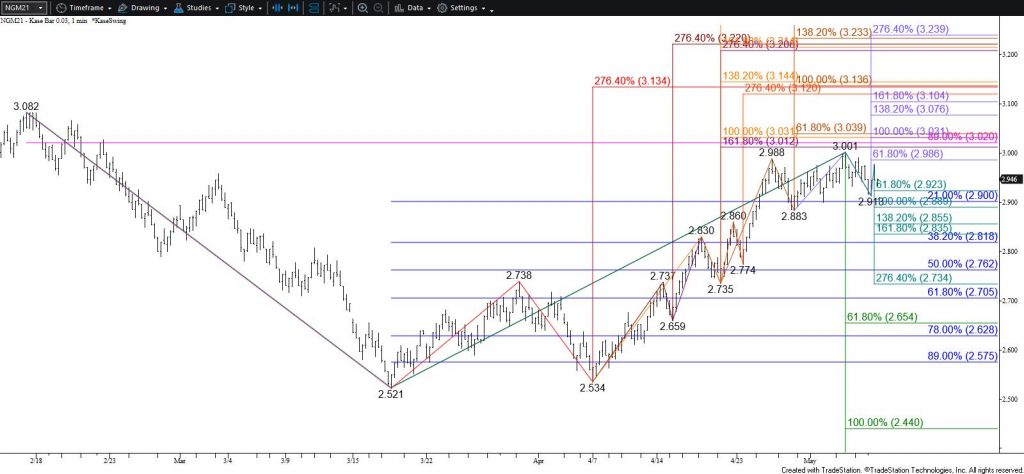
The outlook for natural gas remains bullish because the move up from $2.521 looks to be forming a five-wave pattern that targets at least $3.03 and possibly $3.13. However, the move up is showing signs of exhaustion as it tries to overcome $3.00. This includes the potential formation of an ending diagonal pattern for Wave V. Even so, a move above $2.99 will call for $3.03 to be challenged. This is a highly confluent wave projection and retracement. Therefore, natural gas will likely be hard-pressed to settle above $3.03 without another test of support first. An eventual close above $3.03 would call for $3.08 and likely $3.13.

That said, momentum oscillators are waning and the bearish daily candlestick patterns, including a bearish engulfing line today, suggest a test of $2.90 and possibly $2.86 might take place first. Support at $2.86 is expected to hold. However, taking out $2.86 will call key support at $2.83 to be challenged. Settling below $2.83 remains doubtful but would reflect a bearish shift in supply and demand and near-term sentiment.

Natural Gas - $0.03 Kase Bar Chart
Natural Gas – $0.03 Kase Bar Chart

This is a brief analysis for the next day or so. Our weekly Natural Gas Commentary and daily updates are much more detailed and thorough energy price forecasts that cover key natural gas futures contracts, calendar spreads, the UNG ETF, and several electricity contracts. If you are interested in learning more, please sign up for a complimentary four-week trial.

WTI Crude Oil Technical Analysis and Short-Term Forecast

The outlook for WTI crude oil remains bullish after overcoming the $65.47 swing high and challenging the $65.7 target today. This is a potential stalling point because $65.7 is the larger than (1.618) target of the primary wave up from $57.29, the XC (2.764) projection of a subwave up from $60.61, and is in line with the smaller than (0.618) target of a compound wave up from $60.61. Furthermore, a small intraday double top might be forming around $65.8.

WTI Crude Oil - $0.65 Kase Bar Chart
WTI Crude Oil – $0.65 Kase Bar Chart

Nevertheless, any move down will most likely prove to be a short-lived correction. Moreover, a move above $65.84 early tomorrow will negate the potential double top and call for at least $66.7 and possibly the next major objective at $67.7 during the next day or so. The $67.7 objective is the most confluent target on the chart and is crucial because it ties the waves up from $57.29 to the wave structure before the $67.29 swing high. Settling above $67.7 will clear the way for $69.1 and $70.1.

With that said, should WTI take out the $64.96 swing low first, the potential $65.8 double top would be confirmed. This would then call for a test of $64.2, which is in line with the pattern’s target, today’s open, and the 21 percent retracement of the rise from $57.29. Support at $64.2 is expected to hold, but a close below this will call for a test of key near-term support at $62.6. Settling below $62.6 is doubtful but would reflect a bearish shift in near-term sentiment.

This is a brief analysis for the next day or so. Our weekly Crude Oil Forecast and daily updates are much more detailed and thorough energy price forecasts that cover WTI, Brent, RBOB Gasoline, Diesel, and spreads. If you are interested in learning more, please sign up for a complimentary four-week trial.

Gold Technical Analysis and Near-Term Outlook

Gold’s pullback from $1798.4 has been shallow and choppy compared to the prior move up. So far, the pullback has held $1752. This is the 38 percent retracement of the rise from $1677.3 and the equal to (1.00) target of the primary wave down from $1798.4. This means the decline is most likely corrective. Therefore, near-term odds favor a continued rise.

Gold - $5 Kase Bar Chart
Gold – $5 Kase Bar Chart

There is immediate resistance at $1881 but closing above $1791 would overcome the $1789.9 swing high and invalidate the primary wave down from $1798.4. Given the resilience of the pullback, settling above $1791 would also be a strong indication that the correction is complete, clearing the way for the next major targets at $1806 and $1837.

With that said, downside risk is increasing. Closing below $1752 would call for a test of $1738 and possibly key support at $1724. The $1738 level is expected to hold due to its confluence. The $1724 threshold is key because it is the 62 percent retracement of the rise from $1677.3. Settling below this would imply that the move up is over and shift longer-term odds back in favor of a continued decline.

This is a brief analysis for the next day or so. Our weekly Metals Commentary and daily updates are much more detailed and thorough energy price forecasts that cover key COMEX precious metals futures contracts and LME Non-Ferrous (Base) metals, spot gold, the gold/silver ratio, and gold ETFs. If you are interested in learning more, please sign up for a complimentary four-week trial.

Natural Gas Technical Analysis and Near-Term Outlook

Natural gas has taken on a more bullish outlook during the past week. The primary subwave up from $2.534 settled above its $2.92 smaller than (0.618) target and favors a test of its $3.03 equal to (1.00) target. The move up is beginning to look exhausted though, so settling above $3.03 will likely be a challenge during the next few days. Even so, this would clear the way for $3.03 and possibly $3.13, which is the highest that the primary wave up from $2.521 projects.

With that said, the move up has stalled just below the psychologically important $3.00 level at $2.988 and formed a bearish shooting star today. Therefore, there is a good chance for a test of $2.91 first. This is Tuesday’s midpoint and the completion point of the shooting star. Closing below $2.91 will call for a test of the shooting star’s $2.87 confirmation point. Confirming the shooting star would call for a deeper test of support before rising to challenge targets around $3.00 again.

Natural Gas - $0.03 Kase Bar Chart
Natural Gas – $0.03 Kase Bar Chart

This is a brief analysis for the next day or so. Our weekly Natural Gas Commentary and daily updates are much more detailed and thorough energy price forecasts that cover key natural gas futures contracts, calendar spreads, the UNG ETF, and several electricity contracts. If you are interested in learning more, please sign up for a complimentary four-week trial.

WTI Crude Oil Technical Analysis and Short-Term Forecast

WTI crude oil broke higher out of an intra-day coil pattern and settled above the $62.43 swing high. This confirmed the double bottom between the $60.61 and $60.66 swing lows that formed Monday. The move up is now positioned to challenge a bullish decision point at $63.5 early tomorrow. This is the larger than (1.618) target of the wave up from $60.61, the 78 percent retracement of the decline from $64.38, and most importantly, the 62 percent retracement of the decline from $67.29.  Closing above $63.5 would imply that the corrective move down from $67.29 is complete, clearing the way for a test of the double bottom’s $64.2 target. This then connects to $64.9 and higher.

WTI Crude Oil - $0.35 Kase Bar Chart
WTI Crude Oil – $0.35 Kase Bar Chart

Nevertheless, when WTI rose to $64.38 just over a week ago $63.5 held on a closing basis. This has been a strong level of resistance and is still a highly confluent wave projection and retracement. Should WTI hold $63.5 look for a test of $62.3 and possibly $61.7. Support at $61.7 is expected to hold. Closing below this would reflect a bearish shift in near-term sentiment and call for a test of $59.8 and possibly lower.

This is a brief analysis for the next day or so. Our weekly Crude Oil Forecast and daily updates are much more detailed and thorough energy price forecasts that cover WTI, Brent, RBOB Gasoline, Diesel, and spreads. If you are interested in learning more, please sign up for a complimentary four-week trial.

Gold Technical Analysis and Near-Term Outlook

Gold rose as expected and has definitively closed above the $1756 confirmation point of the $1676 double bottom. The daily Kase Trend and 10-day DMI indicators are now bullish and the ADX is beginning to rise. Moreover, the primary wave up from $1676.2 calls for $1789, which then connects to $1807. There is still an immediate target at $1776 that gold must contend with. However, because this is the smaller than (0.618) target of the subwave up from $1677.3, a close above this will also call for a push toward this wave’s $1807 equal to (1.00) target. This then connects to $1837 as the intermediate (1.382) target. Rising to $1837 has become more probable during the next few weeks because this is also the target of the confirmed double bottom.

There are no bearish patterns, setups, or signals that call for the move up to stall. However, the $1776 target is highly confluent, and gold is pulling back a bit in post-settlement trading hours. This suggests a test of support might take place before overcoming $1776. Support at $1751 is expected to hold and $1736 is key for the near term. Settling below $1736 will call for a test of the $1723.2 swing low, which is also the 50 percent retracement of the rise from $1677.3. Taking this swing low out will invalidate the subwave up from $1677.3 that projects to $1776 and makes the connection to $1807 and $1837. Therefore, a move below $1723, which is currently doubtful, would shift near-term odds to bearish.

Gold - $5 Kase Bar Chart
Gold – $5 Kase Bar Chart

This is a brief analysis for the next day or so. Our weekly Metals Commentary and daily updates are much more detailed and thorough energy price forecasts that cover key COMEX precious metals futures contracts and LME Non-Ferrous (Base) metals, spot gold, the gold/silver ratio, and gold ETFs. If you are interested in learning more, please sign up for a complimentary four-week trial

WTI Crude Oil Technical Analysis and Short-Term Forecast

WTI crude oil is working its way toward the top of the trading range that prices have been oscillating in during the past few weeks. The outlook remains tight, and the range still looks corrective of the decline from $67.79. Nevertheless, near-term odds favor a test of $61.4. This is the equal to (1.00) target of the wave up from $57.63. Settling above $61.4 will call for $62.5, which then connects to a bullish decision point at $63.8. Settling above $63.8 would imply that the move down from $67.79 is complete and clear the way for $65.6 and higher.

With that said, caution is warranted because the move up has not been able to overcome the $60.90 intra-day swing high during the last few days. Moreover, during the past few weeks each time WTI looks poised to break higher or lower out of the range the move has stalled and reversed course. Therefore, should WTI crude oil take out $59.1 tomorrow look for a test of $58.0, which then connects to a highly confluent support level at $57.0. Settling below $57.0 would call for a test of a bearish decision point at $55.7.

WTI Crude Oil - $0.65 Kase Bar Chart
WTI Crude Oil – $0.65 Kase Bar Chart

This is a brief analysis for the next day or so. Our weekly Crude Oil Forecast and daily updates are much more detailed and thorough energy price forecasts that cover WTI, Brent, RBOB Gasoline, Diesel, and spreads. If you are interested in learning more, please sign up for a complimentary four-week trial.

Gold Technical Analysis and Near-Term Outlook

Gold settled above $1756 and confirmed the $1676 double bottom. The move up is now poised to reach at least $1770 and likely $1788 during the next few days. The $1788 target is most confluent and could prove to be a stalling point. However, settling above $1788 will clear the way for $1807 and possibly a push toward the double bottom’s $1837 target.

There are no bearish patterns or signals that call for the move up to stall. However, the rise from $1677.3 lacks a clear wave structure, so a test of support might take place soon. For now, $1742 is expected to hold and $1728 is key for the near term. Settling below $1728 will call for a test of $1709. Closing below $1709 would imply that the move up is complete and shift longer-term odds back in favor of a continued decline.

Gold - $10 Kase Bar Chart
Gold – $10 Kase Bar Chart

This is a brief analysis for the next day or so. Our weekly Metals Commentary and daily updates are much more detailed and thorough energy price forecasts that cover key COMEX precious metals futures contracts and LME Non-Ferrous (Base) metals, spot gold, the gold/silver ratio, and gold ETFs. If you are interested in learning more, please sign up for a complimentary four-week trial.

Natural Gas Technical Analysis and Near-Term Outlook

Natural gas retains a firm bearish outlook even after today’s somewhat surprising bounce. The move up stalled near the 38 percent retracement of the decline from $2.688 and could not overcome the $2.568 intra-day swing high. This suggests the move up is another correction after breaking lower out of the bearish flag pattern Monday. The move down is poised to challenge $2.46 again, a close below which will call for the next major objective and a potential stalling point at $2.40. Nevertheless, as stated in yesterday’s daily update, an eventual close below $2.40 is expected, which will clear the way for $2.33 and lower.

With that said, today’s move up dampens near-term odds for a continued decline during the next few days. Moreover, should natural gas overcome today’s $2.546 high early tomorrow look for a test of $2.59. This has become a highly confluent resistance level and is in line with the breakout point of the flag. It is common to see a pullback to challenge the breakout point of this type of pattern. Closing above $2.59 is doubtful, but such a move would reflect a bullish shift in near-term sentiment and call for $2.64 and possibly a move back toward crucial upper resistance at $2.69 again.

Natural Gas - $0.03 Kase Bar Chart
Natural Gas – $0.03 Kase Bar Chart

This is a brief analysis for the next day or so. Our weekly Natural Gas Commentary and daily updates are much more detailed and thorough energy price forecasts that cover key natural gas futures contracts, calendar spreads, the UNG ETF, and several electricity contracts. If you are interested in learning more, please sign up for a complimentary four-week trial.

WTI Crude Oil Technical Analysis and Short-Term Forecast

WTI crude oil continues to trade in an indecisive trading range. Today’s initial move up fulfilled the $60.7 smaller than (0.618) target of the primary wave up from $57.25. This was bullish, but the move stalled and the pullback from $60.9 suggests another test of support will probably take place tomorrow. This is a tight call, but near-term odds lean in favor of $58.4, a move below which will call for $57.2. Settling below $57.2 will cause a break lower out of the trading range and call for a test of a bearish decision point at $55.7 that connects to $51.7 and lower.

WTI Crude Oil - $0.65 Kase Bar Chart
WTI Crude Oil – $0.65 Kase Bar Chart

With that said, fulfilling the $60.7 smaller than target of the primary wave up from $57.25 implies that while the $57.63 swing low holds this wave still has good potential to extend to its $62.5 equal to (1.00) target. The connection to $62.5 is made through $61.2, the smaller than target of the wave up from $57.63. Closing above $62.5 would shift near-term odds in favor of testing the $63.8 bullish decision point. Closing above this would strongly suggest that the corrective move down is complete and clear the way for the uptrend to extend to new highs in the coming weeks.

The primary takeaway is not the direction of the call but rather the implications of either a close below $61.2 or above $62.5. Everything else that happens between those levels will likely be noise. Closing beyond either threshold would then call for a test of the longer-term bearish or bullish decision points at $55.7 or $63.8, respectively.

This is a brief analysis for the next day or so. Our weekly Crude Oil Forecast and daily updates are much more detailed and thorough energy price forecasts that cover WTI, Brent, RBOB Gasoline, Diesel, and spreads. If you are interested in learning more, please sign up for a complimentary four-week trial.