Gold Price Forecast – July 1, 2021

Gold Technical Analysis and Near-Term Outlook

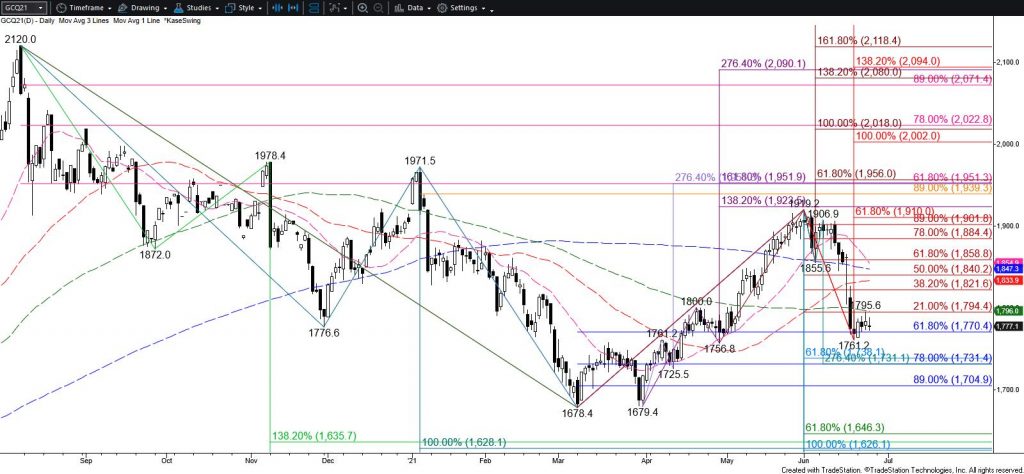
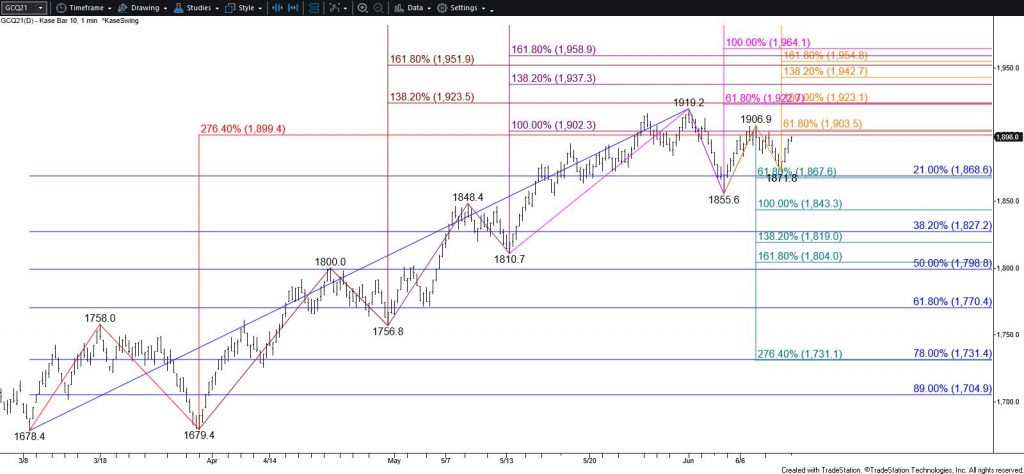
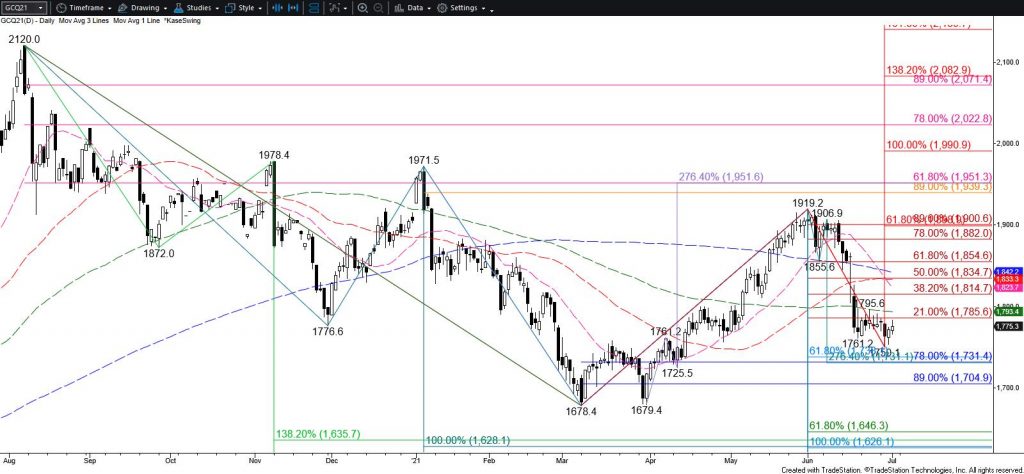
Gold failed to settle above Tuesday’s open and confirm yesterday’s bullish piercing pattern. Gold might be trying to form a bottom, but based upon the wave formations, near-term odds still lean in favor of a decline to challenge the next major objective at $1735. This is the target of the five-wave pattern down from $1919.2. Therefore, once met, a three-wave test of resistance is anticipated. Closing below $1763 will increase odds for a decline to $1754, which then connects to $1735.

Nevertheless, the waves up from $1750.1 warn that a larger test of resistance might take place first. Resistance at $1789 is expected to hold. However, closing above this will call for a test of key near-term resistance at $1802. Settling above $1802 would serve as an early warning that a bottom has been made and call for $1815 and possibly higher in the coming days.

Gold - Daily Chart
Gold – Daily Chart

This is a brief analysis for the next day or so. Our weekly Metals Commentary and daily updates are much more detailed and thorough energy price forecasts that cover key COMEX precious metals futures contracts and LME Non-Ferrous (Base) metals, spot gold, the gold/silver ratio, and gold ETFs. If you are interested in learning more, please sign up for a complimentary four-week trial.

Natural Gas Technical Analysis and Near-Term Outlook

During the past few weeks natural gas has risen at a rate that is not sustainable. There is still risk for a move to challenge $3.90 and possibly $3.99, especially after this afternoon’s late rally to challenge $3.81 again. However, the move up will not likely last much longer and there is a potential double top that has formed at $3.81.

Natural Gas - $0.03 Kase Bar Chart
Natural Gas – $0.03 Kase Bar Chart

Tomorrow, look for a test of $3.69, a move below which will call for $3.60. This is the confirmation point of the double top. Settling below $3.60 will clear the way for an aggressive decline toward the pattern’s $3.40 target in the coming days.

With that said, should natural gas overcome $3.77 early tomorrow look for another test of $3.81. Rising above this will clear the way for $3.90 and possibly $3.99 during the next few days. At this point, there is no strong technical evidence to call for a move above $3.99.

This is a brief analysis for the next day or so. Our weekly Natural Gas Commentary and daily updates are much more detailed and thorough energy price forecasts that cover key natural gas futures contracts, calendar spreads, the UNG ETF, and several electricity contracts. If you are interested in learning more, please sign up for a complimentary four-week trial.

WTI Crude Oil Technical Analysis and Short-Term Forecast

WTI crude oil fell to challenge $72.0 as called for in Monday’s daily update. However, the subsequent move up from $71.97 has formed a wave that is poised to test $73.9. Rising above this objective early tomorrow will clear the way for a major objective at $75.0. This is the most confluent target on the chart and is a probable stalling point.

With that said, the near-term outlook is tight and there is still a reasonable chance for a deeper test of support before reaching $75.0. Should WTI take out $72.1 before overcoming $73.9 look for a test of $71.2. Closing below $71.2 would confirm the daily bearish candlesticks patterns that formed last week and would shift near-term odds in favor of reaching $70.4 and likely $69.6 during the next few days.

WTI Crude Oil - $0.50 Kase Bar Chart
WTI Crude Oil – $0.50 Kase Bar Chart

This is a brief analysis for the next day or so. Our weekly Crude Oil Forecast and daily updates are much more detailed and thorough energy price forecasts that cover WTI, Brent, RBOB Gasoline, Diesel, and spreads. If you are interested in learning more, please sign up for a complimentary four-week trial.

Gold Technical Analysis and Near-Term Outlook

The outlook for gold is bearish. The decline from $1919.2 looks to be forming a five-wave pattern that targets $1734. Gold also broke lower out of an intra-day bearish flag today and is poised to challenge $1763 tomorrow. Settling below this will open the way for $1747 and $1734.

With that said, gold has held above the 62 percent retracement of the rise from $1678.4 at $1770.4 all week. Should gold rise above $1795, which is in line with the 100-day moving average, look for a test of $1809 and then key resistance at $1821. Settling above $1821 would warn that the move down is complete.

Gold - Daily Chart
Gold – Daily Chart

This is a brief analysis for the next day or so. Our weekly Metals Commentary and daily updates are much more detailed and thorough energy price forecasts that cover key COMEX precious metals futures contracts and LME Non-Ferrous (Base) metals, spot gold, the gold/silver ratio, and gold ETFs. If you are interested in learning more, please sign up for a complimentary four-week trial

Natural Gas Technical Analysis and Near-Term Outlook

July natural gas rose to a new high of $3.383 but stalled short of reaching the next major objective at $3.40. Additionally, resistance around $3.35 held on a closing basis. Near-term odds still favor a test of $3.40, and a move back above $3.35 early tomorrow will increase those odds. The $3.40 target is highly confluent and a structurally important projection for the waves up from $2.165 and $2.585. This is a potential stalling point, although an eventual close above $3.40 will call for a push toward another major objective at $3.52.

With that said, one could argue that the pullback from $3.383 suggests a double top with the prior $3.369 double top is forming. The confirmation point for this potential pattern is $3.137, a level that will not likely be met during the next few days. However, based on the pullback there is a good chance for a test of $3.29 and possibly $3.36 first. Key support and the barrier for a near-term bearish outlook is $3.23. Settling below this would shift odds in favor of a deeper test of support before the move up continues to $3.40 and higher.

Natural Gas - $0.03 Kase Bar Chart
Natural Gas – $0.03 Kase Bar Chart

This is a brief analysis for the next day or so. Our weekly Natural Gas Commentary and daily updates are much more detailed and thorough energy price forecasts that cover key natural gas futures contracts, calendar spreads, the UNG ETF, and several electricity contracts. If you are interested in learning more, please sign up for a complimentary four-week trial.

WTI Crude Oil Technical Analysis and Short-Term Forecast

WTI crude oil is still poised to reach at least $73.7 and ultimately the next major objective at $75.0. However, today’s bearish doji warns that a test of support will probably take place first. Moreover, Kase StatWare formed a bearish KasePO (momentum) divergence and a short warning signal on a $0.35 Kase Bar chart. Support at $72.1 will likely hold and $71.2 is key support for the near term. Closing below $71.2 will confirm the bearish doji and shift near-term odds in favor of $70.6 and likely a test of $69.8 before the move up continues.

WTI Crude Oil - $0.35 Kase Bar Chart with Kase StatWare
WTI Crude Oil – $0.35 Kase Bar Chart with Kase StatWare

This is a brief analysis for the next day or so. Our weekly Crude Oil Forecast and daily updates are much more detailed and thorough energy price forecasts that cover WTI, Brent, RBOB Gasoline, Diesel, and spreads. If you are interested in learning more, please sign up for a complimentary four-week trial

Gold Technical Analysis and Near-Term Outlook

Gold stalled before taking out the $1868 smaller than (0.618) target of the primary wave down from $1919.2 today. The subsequent move up is now poised to rise above $1903. This is the smaller than target of the wave up from $1855.6, which then connects to $1923 as the equal to (1.00) target. Therefore, near-term odds favor a test of at least $1911, the last target protecting the $1919.2 swing high. Closing above $1911 will clear the way for $1923, which then connects to $1940 and higher.

Nevertheless, recent bearish daily candlesticks warn that the move up remains hesitant. Should gold take out $1882 look for a test of $1868 and possibly $1854. The $1854 level is crucial because it is in line with the 200-day moving average. Closing below this would open the way for $1843 and likely a deeper test of support before the move up continues.

Gold - $10 Kase Bar Chart
Gold – $10 Kase Bar Chart

This is a brief analysis for the next day or so. Our weekly Metals Commentary and daily updates are much more detailed and thorough energy price forecasts that cover key COMEX precious metals futures contracts and LME Non-Ferrous (Base) metals, spot gold, the gold/silver ratio, and gold ETFs. If you are interested in learning more, please sign up for a complimentary four-week trial.

Natural Gas Technical Analysis and Near-Term Outlook

Natural gas held $3.17 resistance as expected in yesterday’s daily update before falling toward $3.11 again. The near-term outlook leans neutral-to-negative and a move below $3.11 early tomorrow will call for a test of $3.08. For the move up to retain a reasonable chance at rising above the $3.20 double top during the next few days, $3.08 must hold. Closing below this will call for a test of $3.05 and likely crucial support at $3.01. Settling below $3.01 is doubtful during the next few days but would call for natural gas to challenge the double top’s $2.903 confirmation point.

With that said, should natural gas overcome $3.17 before taking out $3.08 look for a test of $3.21. Settling above $3.21 would negate the double top and shift odds firmly back in favor of rising to $3.25 and $3.29.

Natural Gas - $0.03 Kase Bar Chart
Natural Gas – $0.03 Kase Bar Chart

This is a brief analysis for the next day or so. Our weekly Natural Gas Commentary and daily updates are much more detailed and thorough energy price forecasts that cover key natural gas futures contracts, calendar spreads, the UNG ETF, and several electricity contracts. If you are interested in learning more, please sign up for a complimentary four-week trial.

WTI Crude Oil Technical Analysis and Short-Term Forecast

WTI crude oil fell to challenge support at $68.7 as expected before rallying above the psychologically important $70.0 level. Prices settled just above $70.0 and are rising in post-settlement trading hours. There is immediate an immediate target at $70.4, but the move up is poised to reach $71.2 during the next day or so.

The $71.2 target is a highly confluent objective and potential stalling point for WTI. However, there is no technical evidence that calls for a major reversal. Therefore, any move down will most likely prove to be corrective. Initial support is $69.3 and key near-term support is $68.3. Settling below $68.3 would call for a deeper test of support before the uptrend continues.

WTI Crude Oil - $0.65 Kase Bar Chart
WTI Crude Oil – $0.65 Kase Bar Chart

This is a brief analysis for the next day or so. Our weekly Crude Oil Forecast and daily updates are much more detailed and thorough energy price forecasts that cover WTI, Brent, RBOB Gasoline, Diesel, and spreads. If you are interested in learning more, please sign up for a complimentary four-week trial.

Natural Gas Technical Analysis and Near-Term Outlook

Natural gas pulled back a bit and formed an inside day. Yesterday’s $3.07 midpoint held on a closing basis but the wave down from $3.15 still has potential to extend. Trading will likely become more erratic during the next few days as the pullback still looks corrective. Near-term odds favor a continued rise, though they have been dampened. Overcoming $3.11 will call for a test of $3.16, a close above which will clear the way for a push toward $3.20 and higher.

Nevertheless, should the pullback from $3.15 extend first look for a test of $3.04 and possibly $3.00. Closing below $3.00 would imply that yesterday’s move up was another premature rally. In this scenario, prices could fall toward $2.96 and even $2.91 again, but overall, such a move would be reflective of natural gas settling into a wide trading range.

Natural Gas - $0.03 Kase Bar Chart
Natural Gas – $0.03 Kase Bar Chart

This is a brief analysis for the next day or so. Our weekly Natural Gas Commentary and daily updates are much more detailed and thorough energy price forecasts that cover key natural gas futures contracts, calendar spreads, the UNG ETF, and several electricity contracts. If you are interested in learning more, please sign up for a complimentary four-week trial.