Gold and Silver Price Forecast – May 28, 2020

Gold Price Forecast

The long-term outlook for gold remains bullish. However, the near-term outlook calls for a larger test of support before the move up continues.

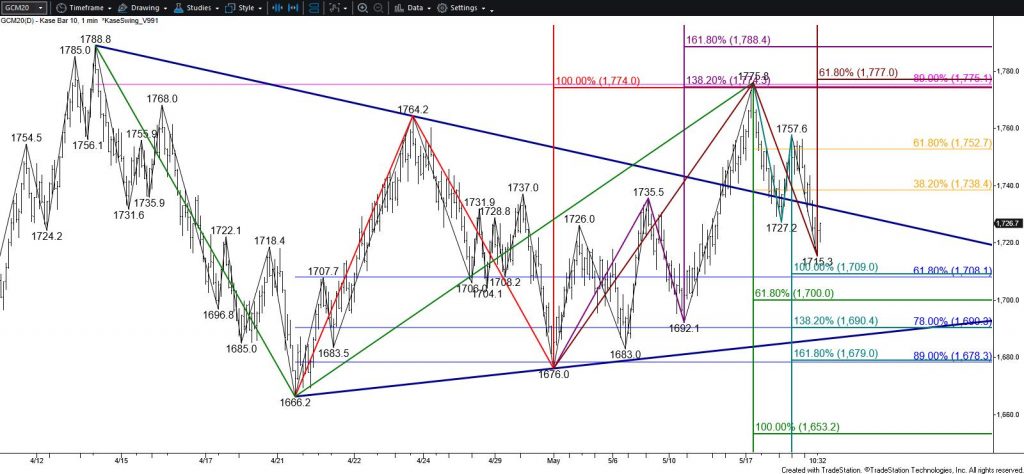
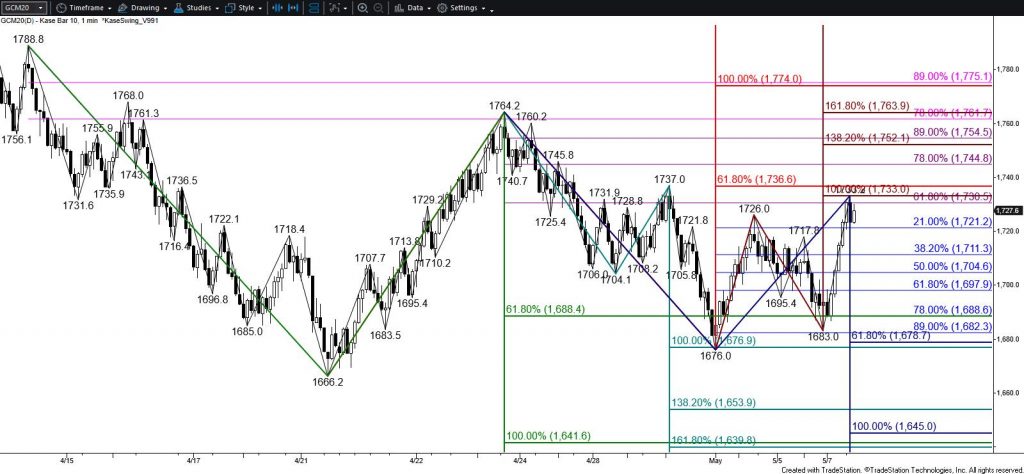
During the last few days, gold prices have fallen back into the range of a bullish coil that prices had broken higher out of on May 14. Yesterday, gold tested and held the lower trend line of the pattern and today the upper trend line. This afternoon’s decline from the upper trend line formed a long upper shadow on the daily candlestick, which is negative for the outlook during the next few days.

Gold – $10 Kase Bar Chart

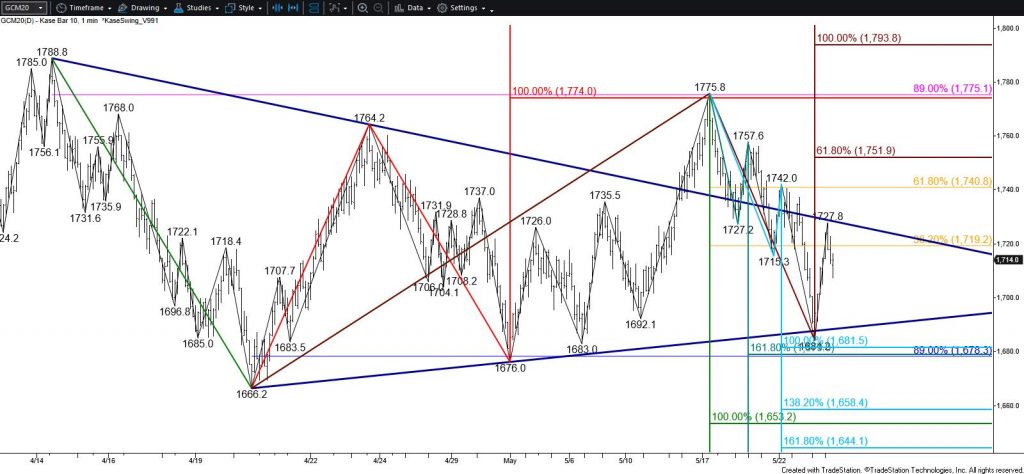
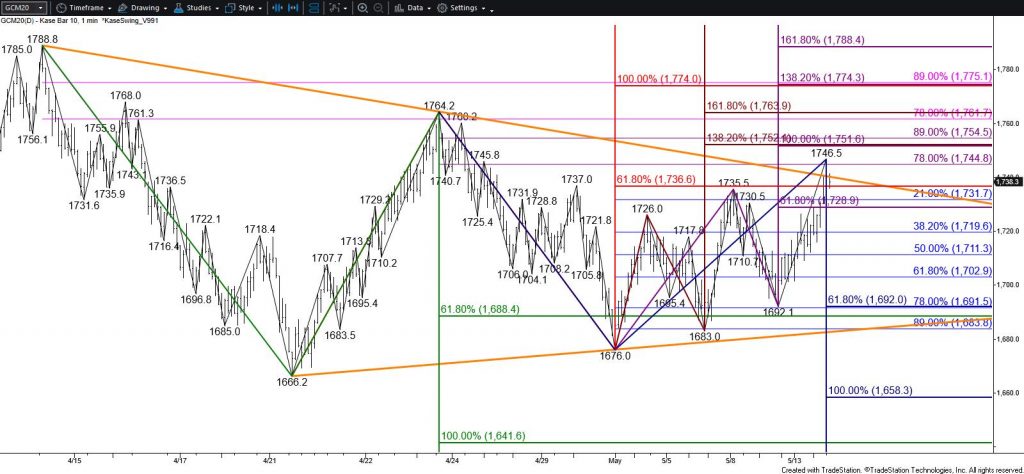
The primary wave down from $1788.8 has taken out its smaller than (0.618) target. Most waves that take out the smaller than target extend to the equal to (1.00) target, in this case, $1653. Therefore, near-term odds favor a larger downward correction where $1653 is the key objective. Tomorrow, look for at least $1697 and possibly $1681. Closing below $1681 will significantly increase odds for $1653. Nonetheless, at this point, the move down is most likely corrective and $1653 is expected to hold.

Conversely, should gold overcome $1741, the 62 percent retracement of the decline from $1755.8, near-term odds will shift in favor of $1752, which then connects to $1775 and eventually $1796.

Silver Price Forecast

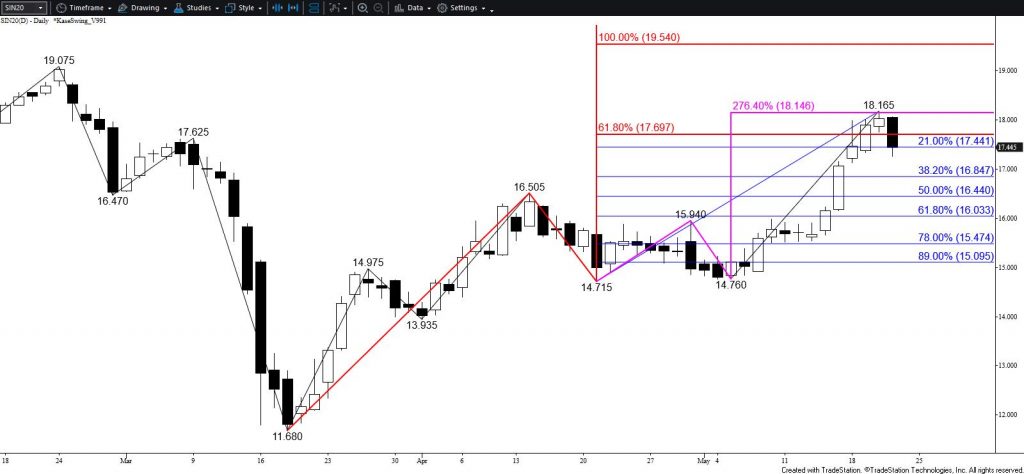
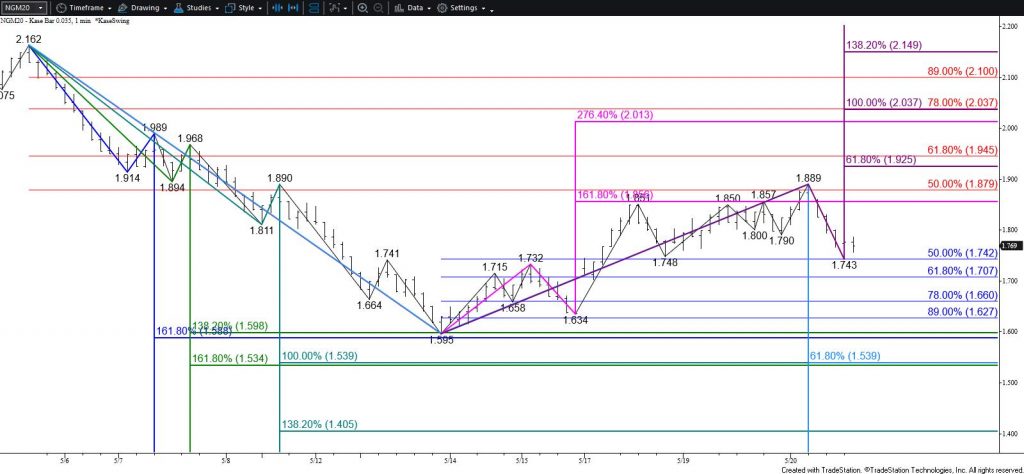
July silver is working its way back toward the $18.165 swing high and overcame the $18.08 equal to (1.00) target of the wave up from $17.19 today. Ultimately, silver is expected to reach $19.55, the equal to target of the primary wave up from $11.68. The connection to $19.55 is made through $18.40 and then $18.60. Rising to $19.55 will likely take at least another few weeks.

Silver – Daily Chart

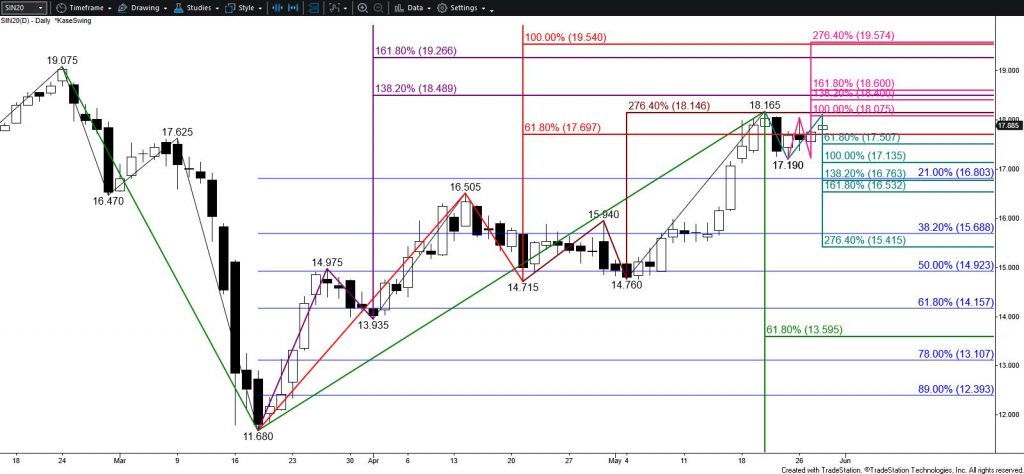
Nonetheless, because the $18.08 target held on a closing basis today, a small test of support might take place first. Support at $17.52 is expected to hold. Closing below this will call for a test of $17.14. Settling below $17.14 is doubtful and would reflect a bearish shift in near-term sentiment. This would also open the way for a much more substantial test of support before the move up continues toward $19.55 as expected.

This is a brief analysis for the next day or so. Our weekly Metals Commentary and daily updates are much more detailed and thorough energy price forecasts that cover key COMEX precious metals futures contracts and LME Non-Ferrous (Base) metals, spot gold, the gold/silver ration, and gold ETFs. If you are interested in learning more, please sign up for a complimentary four-week trial.

July natural gas, which is now the prompt month futures contract, held $1.96 resistance and is poised to challenge at least $1.83 and likely $1.78 during the next few days. The $1.78 target is the lowest the first wave down from $2.027 projects and the equal to (1.00) target of the primary wave down from $2.027. Closing below $1.78 will call for prices to fall toward $1.70 where the continuation chart’s rollover gap up from June’s $1.722 settle will be filled.

The $1.70 objective is also the smaller than (0.618) target of the largest wave down from $2.364. Closing below $1.70 may be a challenge without help from bearish external factors. Also, due to the importance of $1.70 and its connection to a new 2020 continuation chart low, it is doubtful that prices fall below $1.70 without another significant test of resistance first.

Natural Gas – $0.030 Kase Bar

There is an immediate support target at $1.86 that may hold early tomorrow. This is the smaller than (0.618) target of the primary wave down from $2.027 and makes the connection to $1.78 and $1.70. Resistance at $1.95 is expected to hold and $2.02 is key. Settling above $2.02 would shift near-term odds in favor of $2.07 and possibly higher before another downturn.

This is a brief analysis for the next day or so. Our weekly Natural Gas Commentary and daily updates are much more detailed and thorough energy price forecasts that cover key natural gas futures contracts, calendar spreads, the UNG ETF, and several electricity contracts. If you are interested in learning more, please sign up for a complimentary four-week trial.

WTI Crude Oil Price Forecast

The outlook for WTI crude oil is bullish and the move up is poised to reach $35.1. This is a crucial objective because it is the equal to (1.00) target of the primary wave up from $17.27. It is also the equal to target for today’s small intra-day wave up from $33.38. Closing above $35.1 will open the way for $35.9 and then then next major objective of $37.0.

Nevertheless, the move up is due for a correction before rising much higher. Today’s move to a new recovery high of $34.81 negated the bearish KaseCD divergence that was confirmed on Friday. But, Friday’s hanging man is still intact. Also, the daily Stochastic is overbought and the 10-day ADX is falling, which suggests the uptrend is losing strength. Therefore, once $35.1 is met, odds for a test of support will substantially increase.

WTI Crude Oil – $0.35 Kase Bar

Any move down will most likely prove to be corrective, but a minimal test of support should drop prices to $31.2. This is the 21 percent retracement of the move up from $17.27 and the 89 percent retracement from $30.72. Should WTI fall below $33.6 before rising to $35.1, look for the connection to $31.2 to be made through $33.1 and $32.3.

Brent Crude Oil Price Forecast

Brent crude oil overcame its $37.17 swing high and stalled at $37.24. Nonetheless, the subsequent move down to $35.83 held the 38 percent retracement of the rise from $33.94. Also, this afternoon’s move up overcame the 62 percent retracement of the decline from $37.24. Therefore, even though Brent is overdue a larger downward correction, near-term odds continue to favor higher prices.

Tomorrow, look for $37.1. A move above this will clear the way for $37.8 and then the next major objective at $38.6.

Should Brent turn lower before overcoming $37.1 again, look for initial support at $36.1. Falling below $36.1 will call for $35.6 and possibly key near-term support at $35.1. Closing below $35.1 will open the way for $34.2 and possibly a much more significant correction as anticipated.

This is a brief analysis for the next day or so. Our weekly Crude Oil Forecast and daily updates are much more detailed and thorough energy price forecasts that cover WTI, Brent, RBOB Gasoline, Diesel, and spreads. If you are interested in learning more, please sign up for a complimentary four-week trial.

Gold Price Forecast

Gold fell below the upper trend line of the bullish coil that prices broke out of on May 14. The pullback from $1755.8 is most likely corrective but is poised to extend to $1704 ahead of the holiday weekend. This is in line with the equal to (1.00) target of the wave down from $1775.8, the smaller than (0.618) target of the primary wave down from $1788.8, and the 62 percent retracement of the move up from $1666.2.

The confluence and importance of targets around $1704 make it a decision point for a bearish near-term outlook. For the move up to continue during the next few days $1704 must hold.

Gold – $10 Kase Bar Chart

Closing below $1704 will call for $1679 and likely $1653. Support at $1653 is expected to hold.

Should $1704 hold, look for initial resistance at $1738 and key near-term resistance at $1753. Settling above $1753 will shift near-term odds back in favor of $1777, which then connects to $1799 and the next major objective at $1821.

Silver Price Forecast

The long-term outlook for silver is bullish. However, the recent move up stalled at the XC (2.764) projection of the primary wave up from $14.715. This is the highest this wave projects. The subsequent move down formed a bearish engulfing line and confirmed an evening star today. This strongly implies that a deeper correction will take place during the next day or so before the move up continues.

Based on the intra-day waves down from $18.165, look for a test of at least $17.13 and possibly $16.91 before the move up continues. The $16.91 objective is split between the larger than (1.618) target of the primary wave down from $18.165 and the 38 percent retracement of the rise from $14.715. For the move up to continue during the next few days $16.91 must hold. Closing below this would call for $16.39 and possibly $16.03 before silver rallies again.

Silver – Daily Chart

Should silver turn higher before taking out $17.13 support, look for initial resistance at $17.82 and key resistance at $18.08. Settling above $18.08 would shift near-term odds back in favor of rising toward the next major objective at $19.54 with interposed targets at $18.42 and $18.74.

This is a brief analysis for the next day or so. Our weekly Metals Commentary and daily updates are much more detailed and thorough energy price forecasts that cover key COMEX precious metals futures contracts and LME Non-Ferrous (Base) metals, spot gold, the gold/silver ration, and gold ETFs. If you are interested in learning more, please sign up for a complimentary four-week trial.

During the past few days June natural gas has risen to challenge the lower trend line of the bearish flag pattern that prices broke lower out of on May 12. This is common after breaking lower out of this type of pattern. The pullback is most likely corrective and briefly overcame the lower trend line this morning. The trend line is also in the vicinity of the 21- and 50- day moving averages and a few crucial wave projections and the 50 percent retracement of the decline from $2.162. All of these levels held on a closing basis. The subsequent move down left a long upper shadow on the daily candlestick and retraced 50 percent of the move up from $1.595.

Natural Gas – $0.035 Kase Bar

Today’s price action was bearish for the outlook during the next few days and calls for a test at least $1.71. This is the 62 percent retracement of the move up from $1.595, a close below which will significantly increase odds for another attempt at $1.59. The $1.59 objective is still a relatively confluent and important target that could hold. However, settling below this would call for $1.55, which is now the last level of support protecting the $1.519 swing low on the continuation chart.

The decline from $1.889 lacks a definitive wave structure, so a test of resistance might take place early tomorrow. Resistance at $1.83 is expected to hold. Key resistance is $1.87. Settling above this would put prices back above the flag’s lower trend line and call for a push toward $1.92, which then connects to $2.02. This is doubtful but would reflect a bullish shift in fundamental factors and near-term sentiment.

This is a brief analysis for the next day or so. Our weekly Natural Gas Commentary and daily updates are much more detailed and thorough energy price forecasts that cover key natural gas futures contracts, calendar spreads, the UNG ETF, and several electricity contracts. If you are interested in learning more, please sign up for a complimentary four-week trial.

WTI Crude Oil Price Forecast

The long-term outlook for WTI crude oil is bullish, and based on technical factors, the move up is still poised to challenge the next major objective at $35.1. However, several daily momentum oscillators are overbought, and today’s evening star setup suggests the move up is nearing exhaustion. The challenge, however, is that on the intra-day chart the evening star forms a bullish pennant. Pennant’s normally break in the direction of the trend, in this case, up. A close above $32.6 will confirm a break higher and clear the way for $33.3, $34.2, and possibly $35.1 during the next few days.

WTI Crude Oil – $1.00 Kase Bar

Nevertheless, July WTI’s wave structure up from $17.27 is due for a larger test of support before overcoming $35.1. Also, due to the overbought momentum conditions, this is a case where the bullish coil may fail. Any move down will most likely be corrective and should attract new buyers. Even so, should WTI fall below $31.2, look for $30.8 and possibly $29.9. Closing below $29.9 will open the way for $28.7 and possibly lower before the move up ultimately continues.

Brent Crude Oil Price Forecast

Brent leans a little less bullish than WTI for the near-term, but the overall outlook remains bullish. A move above $35.7 will clear the way for a push toward $36.5 and $37.7 during the next few days.

That said, daily momentum oscillators are overbought, and today’s evening star setup suggests that there is a good chance Brent’s corrective move down from $35.76 will extend first. Support at $33.8 is expected to hold and $32.9 is key. Settling below $32.9 will shift near-term odds in favor of $31.8 and possibly $31.0 before the move up continues.

This is a brief analysis for the next day or so. Our weekly Crude Oil Forecast and daily updates are much more detailed and thorough energy price forecasts that cover WTI, Brent, RBOB Gasoline, Diesel, and spreads. If you are interested in learning more, please sign up for a complimentary four-week trial

This is a brief analysis for the next day or so. Our weekly Metals Commentary and daily updates are much more detailed and thorough energy price forecasts that cover key COMEX precious metals futures contracts and LME Non-Ferrous (Base) metals, spot gold, the gold/silver ration, and gold ETFs. If you are interested in learning more, please sign up for a complimentary four-week trial.

Gold broke higher out of a coil pattern and settled the day above $1737, the smaller than (0.618) target of the wave up from $1666.2. The move up is now poised to reach at least $1752 and likely $1774 during the next few days. Settling above $1774 will clear the way a new high of $1802 and then the next major objective of $1821.

Prices are still flirting with the coil’s upper trend line, so there is a modest chance for another test of support once $1752 is met. Support at $1720 will likely hold, but a decline to $1702 and even $1690 would still be considered corrective of the move up from $1676.0. Settling below $1690 is unlikely but would shift near-term odds in favor of $1658 and possibly lower.

Gold – $10 Kase Bar Chart

June natural gas broke support at $1.66 and fell to a new contract low of $1.595. Based on the waves and sub-waves down from $2.162 this is a highly confluent objective and a potential stalling point. Nonetheless, closing below $1.59 will call for $1.53, the last target protecting the continuation chart’s $1.519 swing low. Settling below $1.519 remains doubtful, but would clear the way for $1.45 and possibly $1.40.

Natural Gas – $0.035 Kase Bar

There are no bullish signals or patterns that suggest the move down will end. However, the wave structure down from $2.162 lacks a definitive test of resistance and is due for an upward correction before prices push much lower.

Prices have risen late this afternoon and will probably challenge today’s $1.66 midpoint early tomorrow. Rising above this would call for a test of $1.71. For now, $1.71 is expected to hold, but a close above this would call for $1.81. This is the 38 percent retracement of the decline from $2.162 and must hold for the move down to extend during the next few days. Settling above $1.81 would imply the decline has stalled again and would call for a much more substantial test of resistance in the coming days and possibly weeks.

This is a brief analysis for the next day or so. Our weekly Natural Gas Commentary and daily updates are much more detailed and thorough energy price forecasts that cover key natural gas futures contracts, calendar spreads, the UNG ETF, and several electricity contracts. If you are interested in learning more, please sign up for a complimentary four-week trial.

WTI Crude Oil Price Forecast

WTI rallied today but stalled short of the crucial $26.3 objective. The long-term outlook for WTI is bullish, but the move up is still due a larger test of support before rising much higher. In addition, with product prices sliding and a negative near-term outlook for Brent, WTI will be hard-pressed to retain enough upward momentum to overcome $26.3. Therefore, tomorrow’s outlook leans bearish and a test of support is expected.

The move down from $26.23 will most likely prove to be corrective. Nevertheless, a bearish intra-day KasePO divergence and the wave down from $26.23 call for a test of $25.0 and likely $24.2 tomorrow. For the move up to extend toward $26.3 and higher again during the next few days $24.2 must hold. Closing below this will call for $22.5 and possibly $21.0.

WTI Crude Oil – $0.35 Kase Bar

Should WTI rally again and overcome $26.3 early tomorrow, look for prices to push for $27.3, $28.4, and eventually the next major objective of $29.1.

Brent Crude Oil Price Forecast

Not much changed for Brent today. The overall outlook is bullish, but Brent broke lower out of a coil yesterday and the wave formation down from $32.27 calls for a test of $28.7 and possibly $27.7 before the move up continues. The $27.7 objective is expected to hold. Nevertheless, a close below this would call for $26.8 and possibly $26.1.

Once $28.7 is met, odds for another test of resistance will increase. Rising above $30.8 will clear the way for $31.5 and then key near-term resistance at $32.1. Settling above $32.1 will put odds firmly back in favor of a continued rise toward the next major objective at $33.4.

This is a brief analysis for the next day or so. Our weekly Crude Oil Forecast and daily updates are much more detailed and thorough energy price forecasts that cover WTI, Brent, RBOB Gasoline, Diesel, and spreads. If you are interested in learning more, please sign up for a complimentary four-week trial

Gold’s formation of a bullish engulfing line today strongly suggests that the primary wave down from $1788.8 may fail to meet its $1642 equal to (1.00) target as previously expected. Instead, prices are poised to rise and challenge at least $1752, which then connects to $1764. Overcoming $1764 would call for a move above the $1764.2 swing high. This would invalidate the wave down from $1788.8 and clear the way for $1797 and higher.

Gold – $10 Kase Bar Chart

Nevertheless, the 62 percent retracement of the move down from $1764.2 held today, and the move up from $1683.0 lacks a definitive wave restructure. Therefore, a test of $1710 support might take place first. This level is expected to hold. Key support for the near-term is $1697. Settling below $1697 would shift near-term odds back in favor of a move toward $1642.

This is a brief analysis for the next day or so. Our weekly Metals Commentary and daily updates are much more detailed and thorough energy price forecasts that cover key COMEX precious metals futures contracts and LME Non-Ferrous (Base) metals, spot gold, the gold/silver ration, and gold ETFs. If you are interested in learning more, please sign up for a complimentary four-week trial.