Short-Term Energy Price Forecasts – November 21, 2017

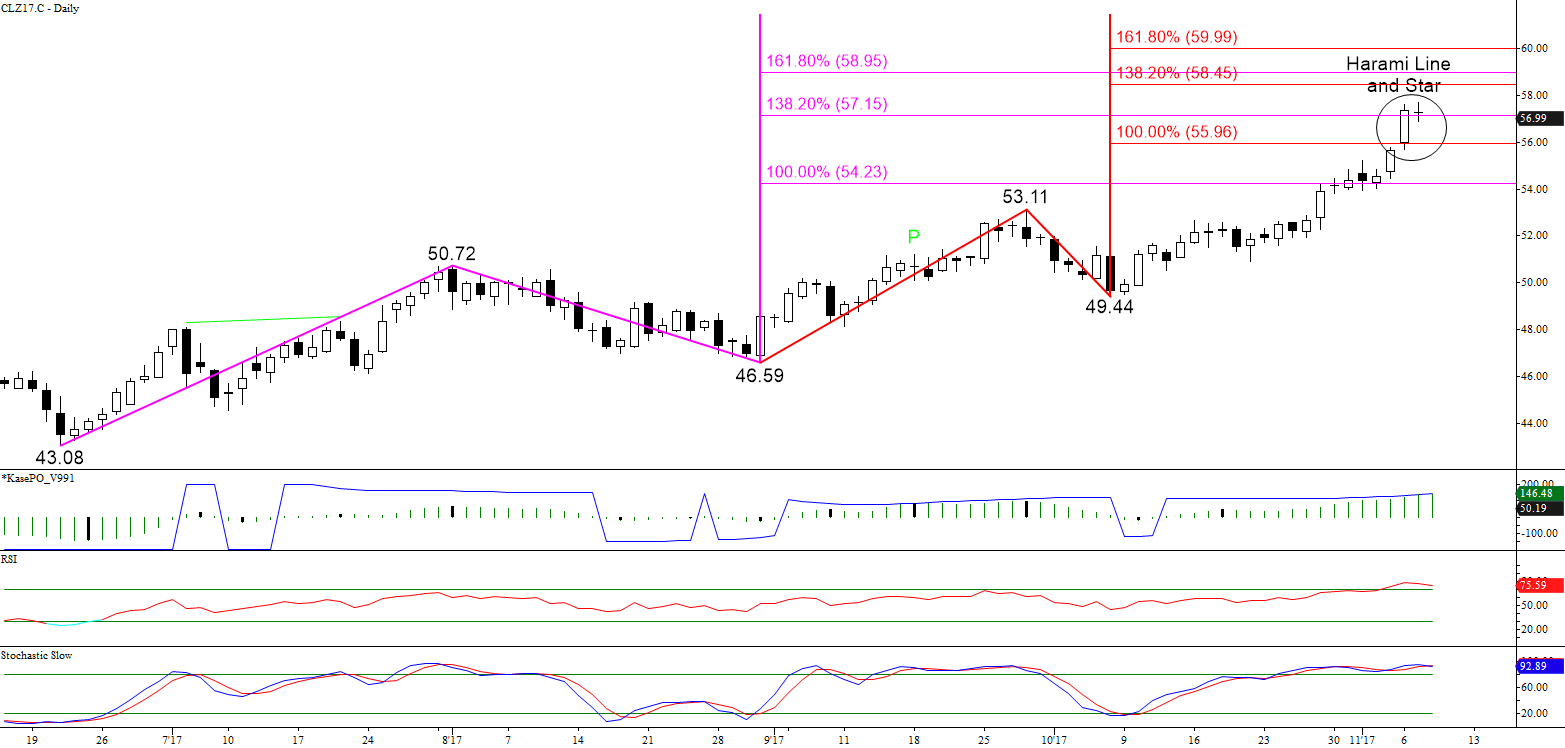
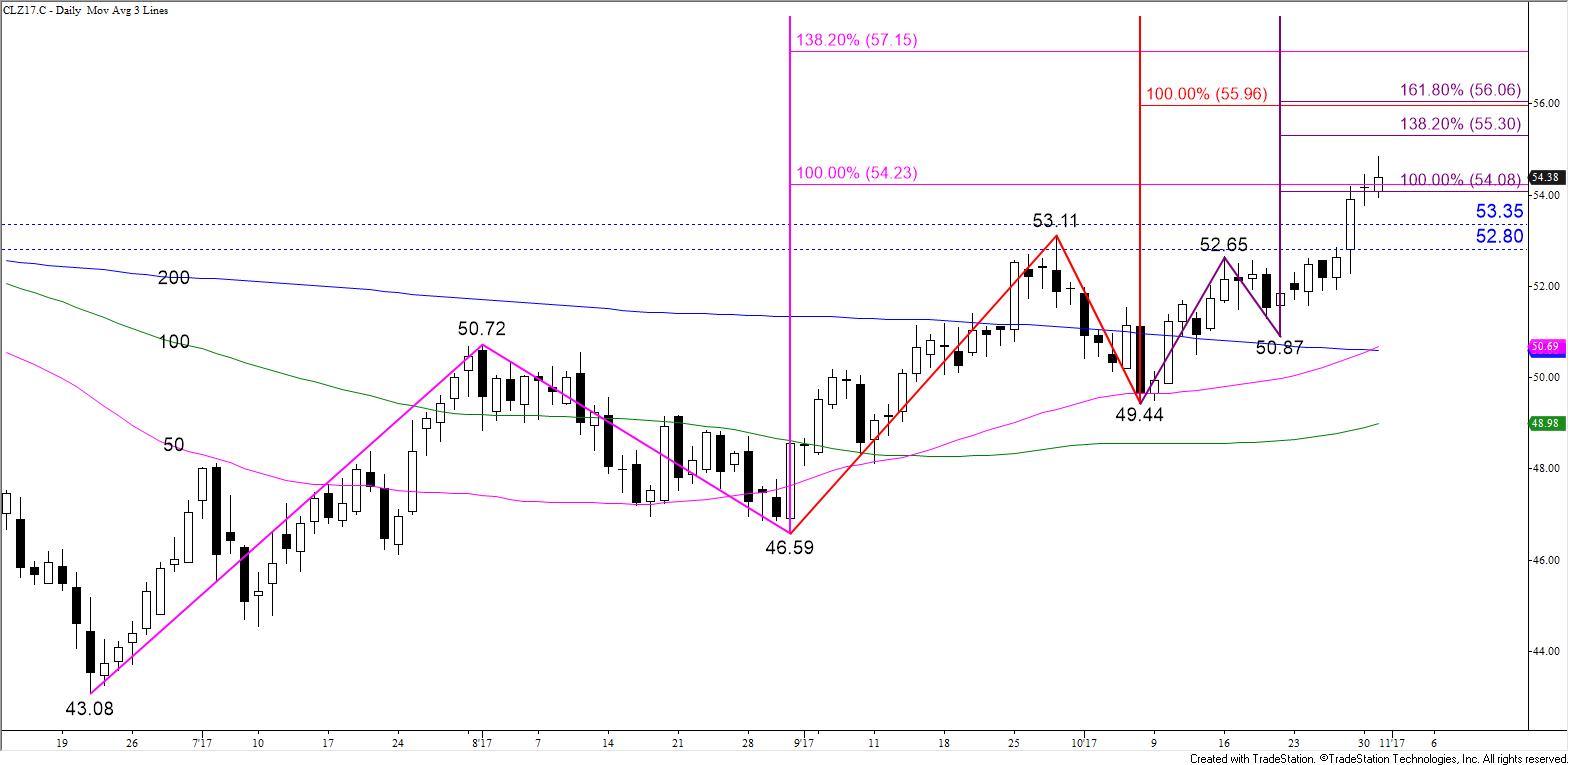
WTI Crude Oil Forecast

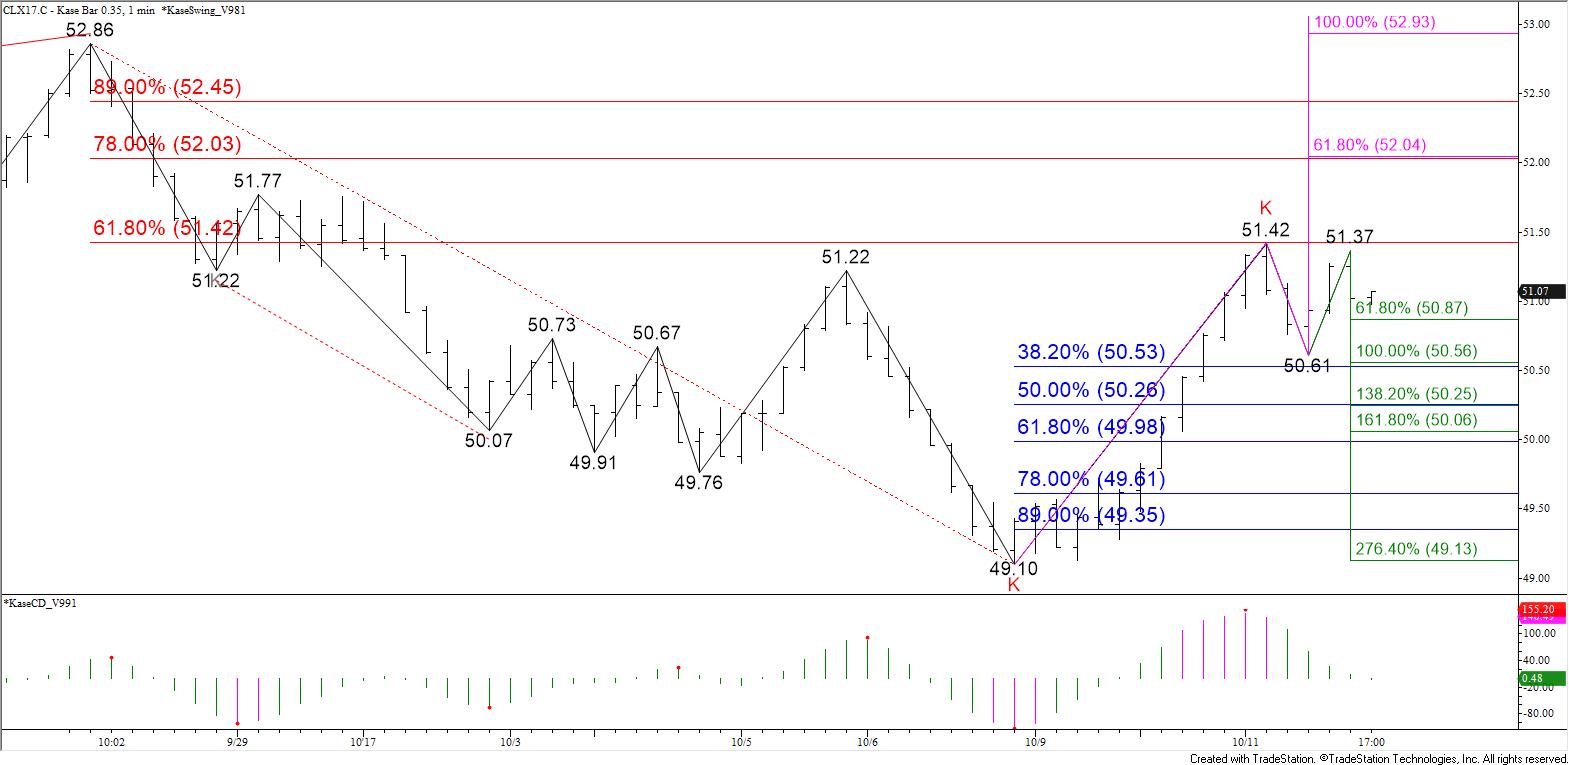
January WTI crude oil settled below $56.94, the 62 percent retracement of the decline from $58.14 to $55.0 and the smaller than (0.618) projection of the wave $55.0 – 56.93 – 55.75. However, this afternoon’s late move above $56.94 indicates the move up should challenge the equal to (1.00) projection at $57.7 tomorrow. This is the last major target protecting against a new high. A close above $57.7 would call for $58.4 and possibly $58.9, the intermediate (1.382) and larger than (1.618) projections for the wave up from $55.0.

CLF18 Kase Bar Chart

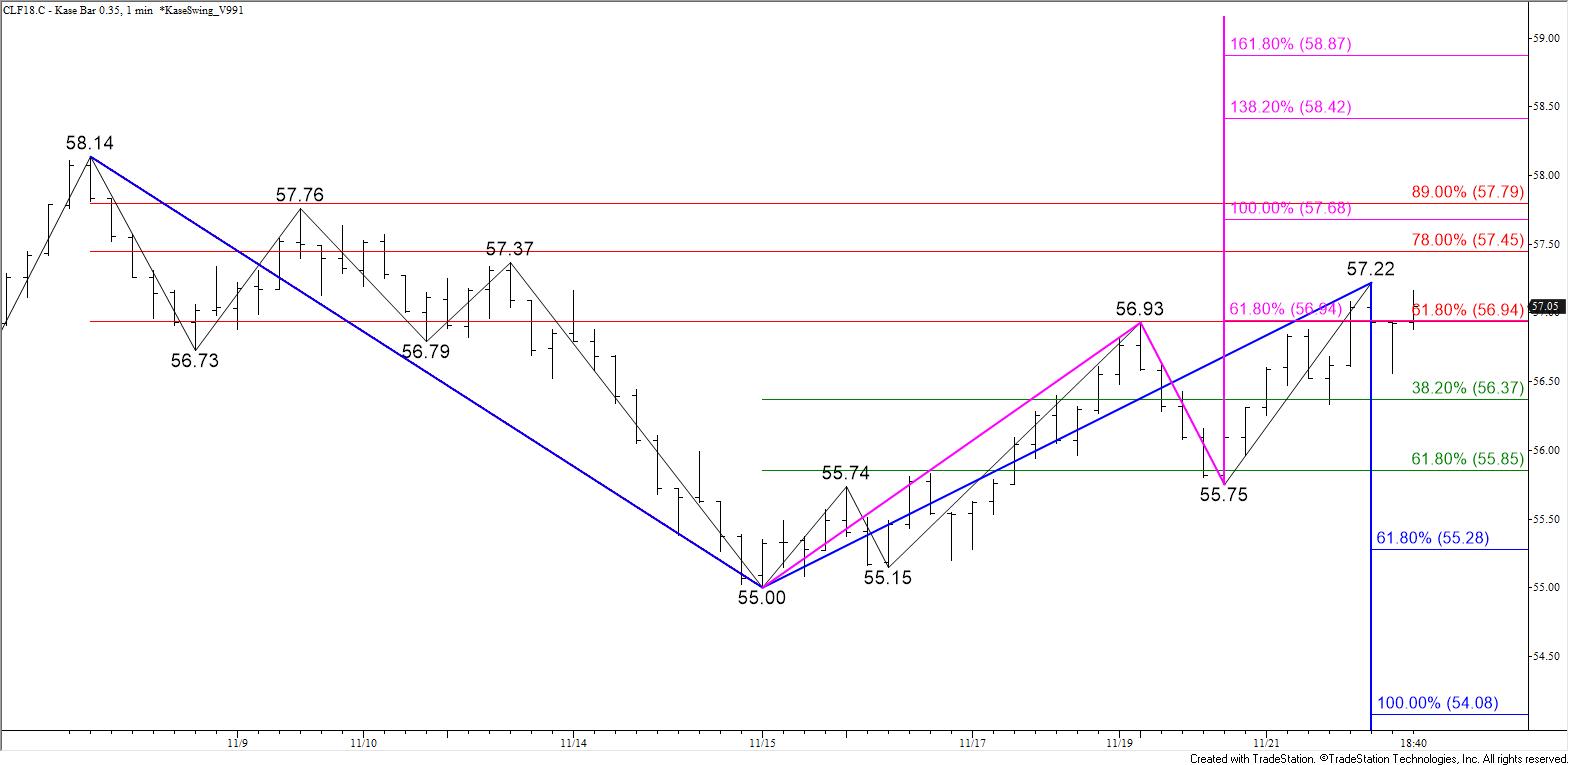
The move up will probably remain choppy and a good test of support will probably take place once $57.7 is met. For now, initial support is $56.4 and key support is $56.9, the 38 and 62 percent retracements of the move up from $55.0 to $57.22, respectively. Settling below $56.9 would shift near-term odds back in favor of $55.2, the smaller than target of the wave $58.14 – 55.0 – 57.22. This wave then connects to $54.1 as the equal to target.

Brent Crude Oil Forecast

Brent’s move up has been more hesitant than WTI’s this week and is still struggling to overcome the $62.92 swing high. However, today’s settle above the smaller than (0.618) projection of the wave $61.08 – 62.92 – 61.44 indicates Brent should rise to at least $63.3 tomorrow. This is the equal to (1.00) target and the 62 percent retracement of the decline from $64.65 to $61.08. The importance of targets at this level indicate there is a good chance that a pullback will take place once $63.3 is met.

Initial support is $62.0 and key support is $61.4. A close below $61.4 would take out the wave up from $61.08 that projects to target at $63.3 and higher and would shift odds back in favor of a continued decline toward $60.8 and lower.

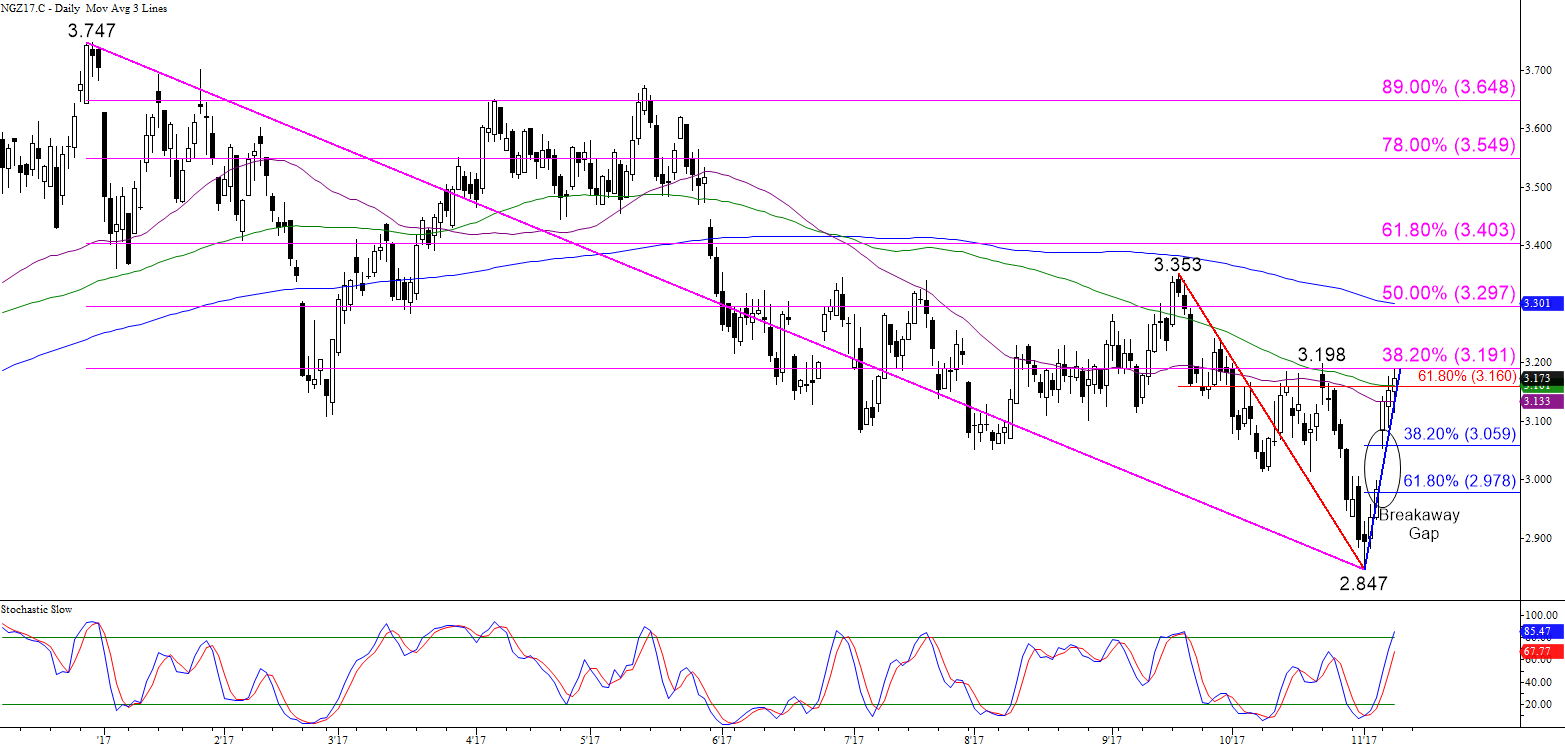
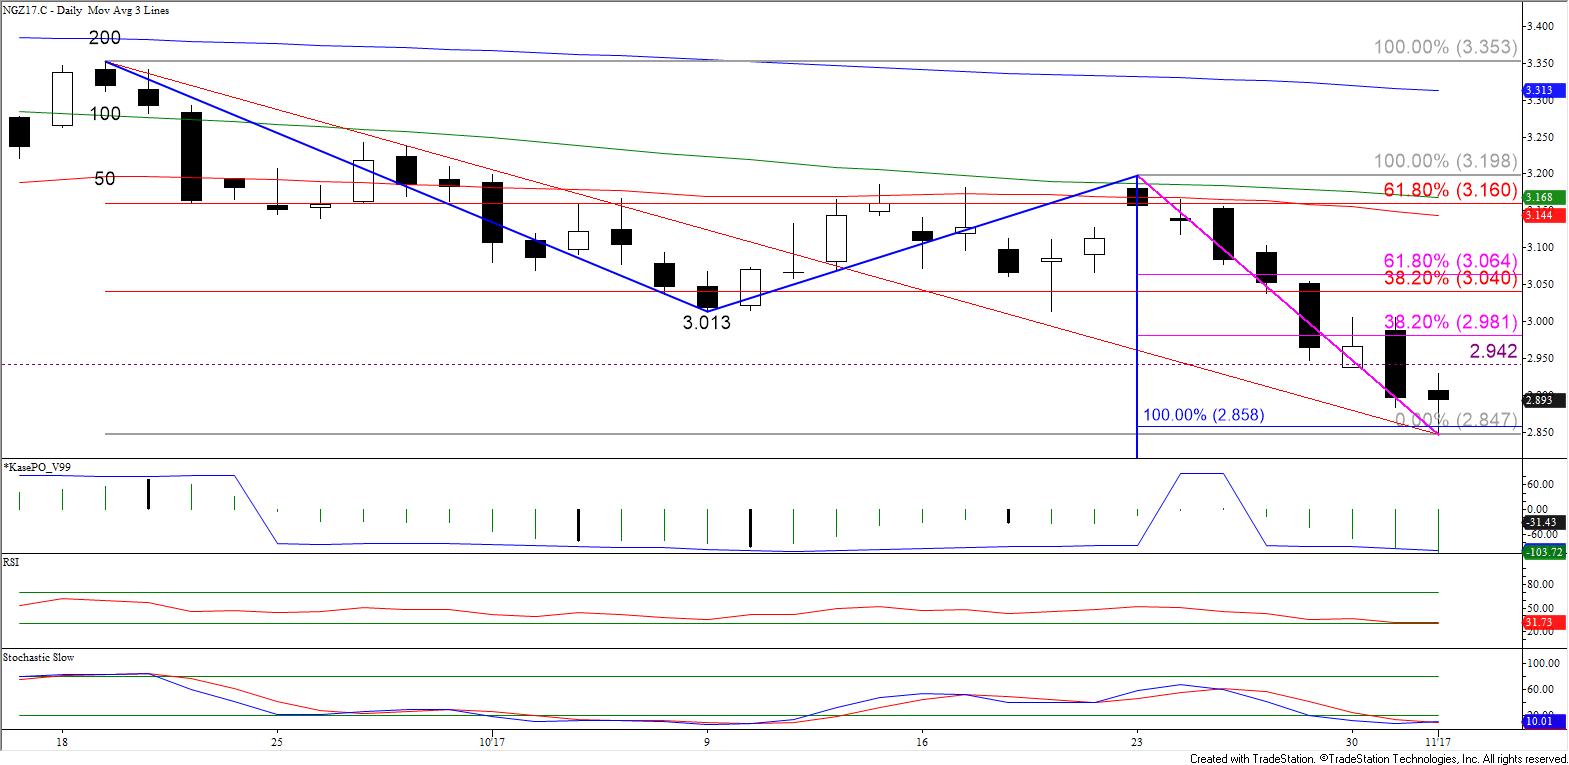
Natural Gas Forecast

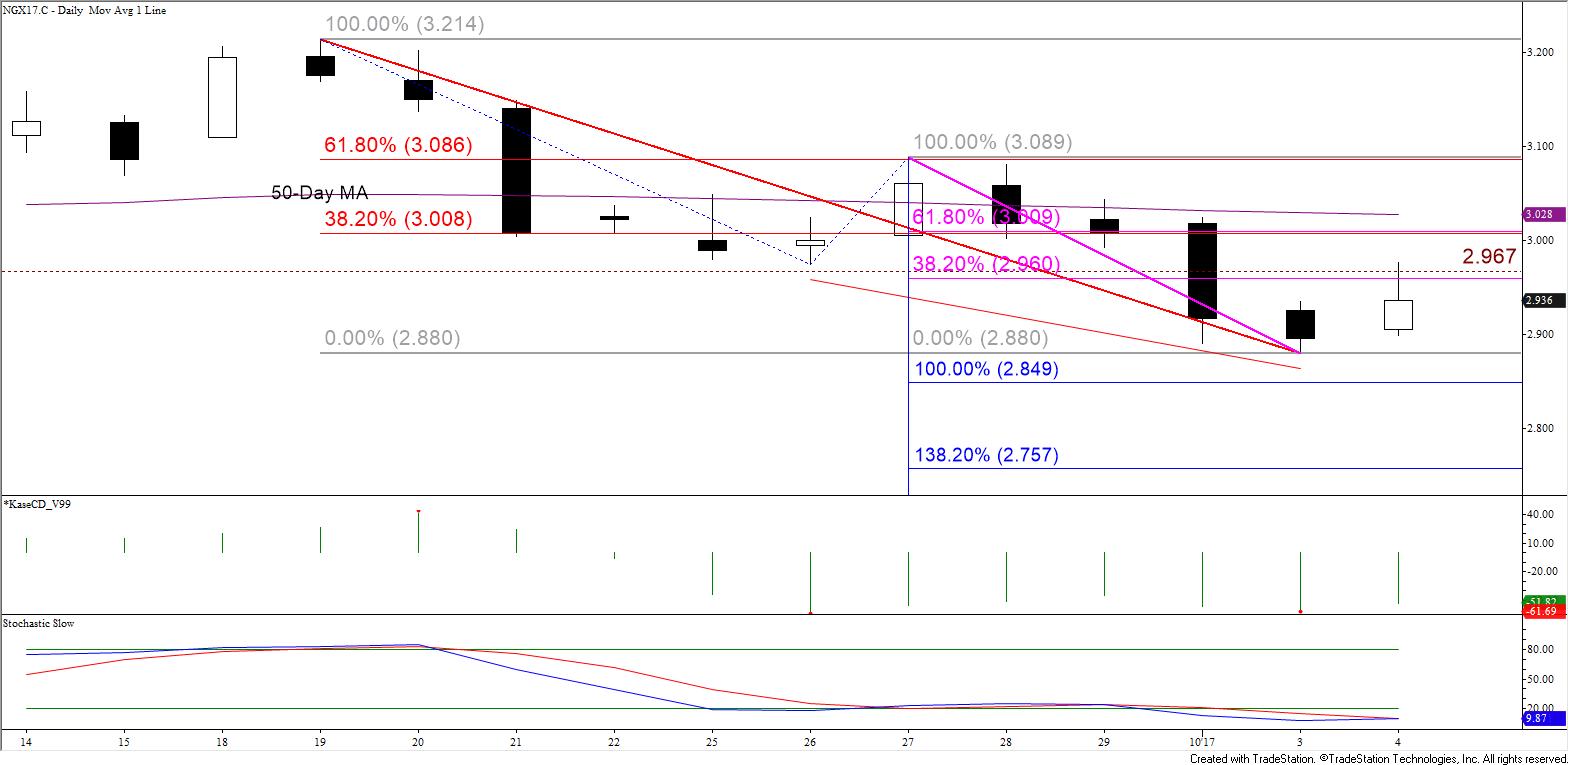
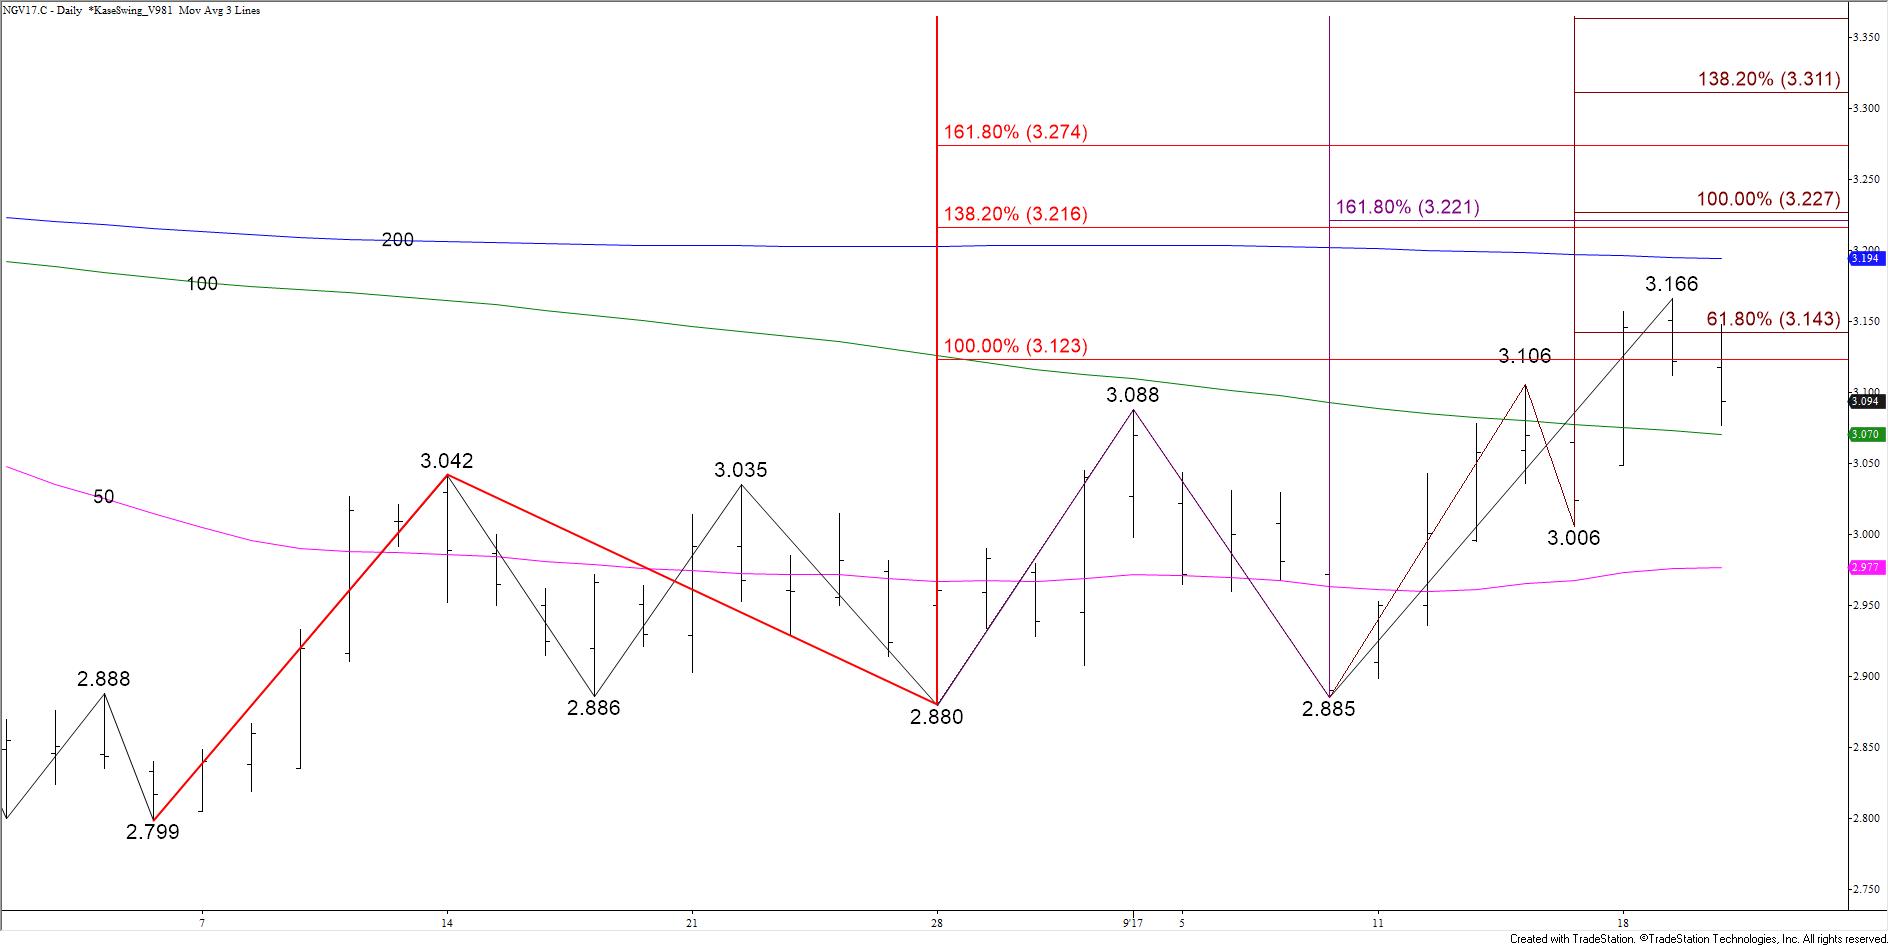
December natural gas hasn’t filled the November 6 gap up from $2.998 yet, but January, February, and March filled their respective gaps today. There is a tremendous amount of support around the bottom of each contract’s gap. Therefore, the move down may stall tomorrow. For December specifically, this area has become $2.99 +/- $0.02.

That said, aside from the confluence of targets around $2.99, the challenge right now is that there are no reversal patterns, only a few intraday divergence setups, that indicate the move down could stall. Therefore, until these signals are confirmed and initial resistance is overcome, near-term odds will favor a continued grind lower.

NGZ17 Kase Bar Chart

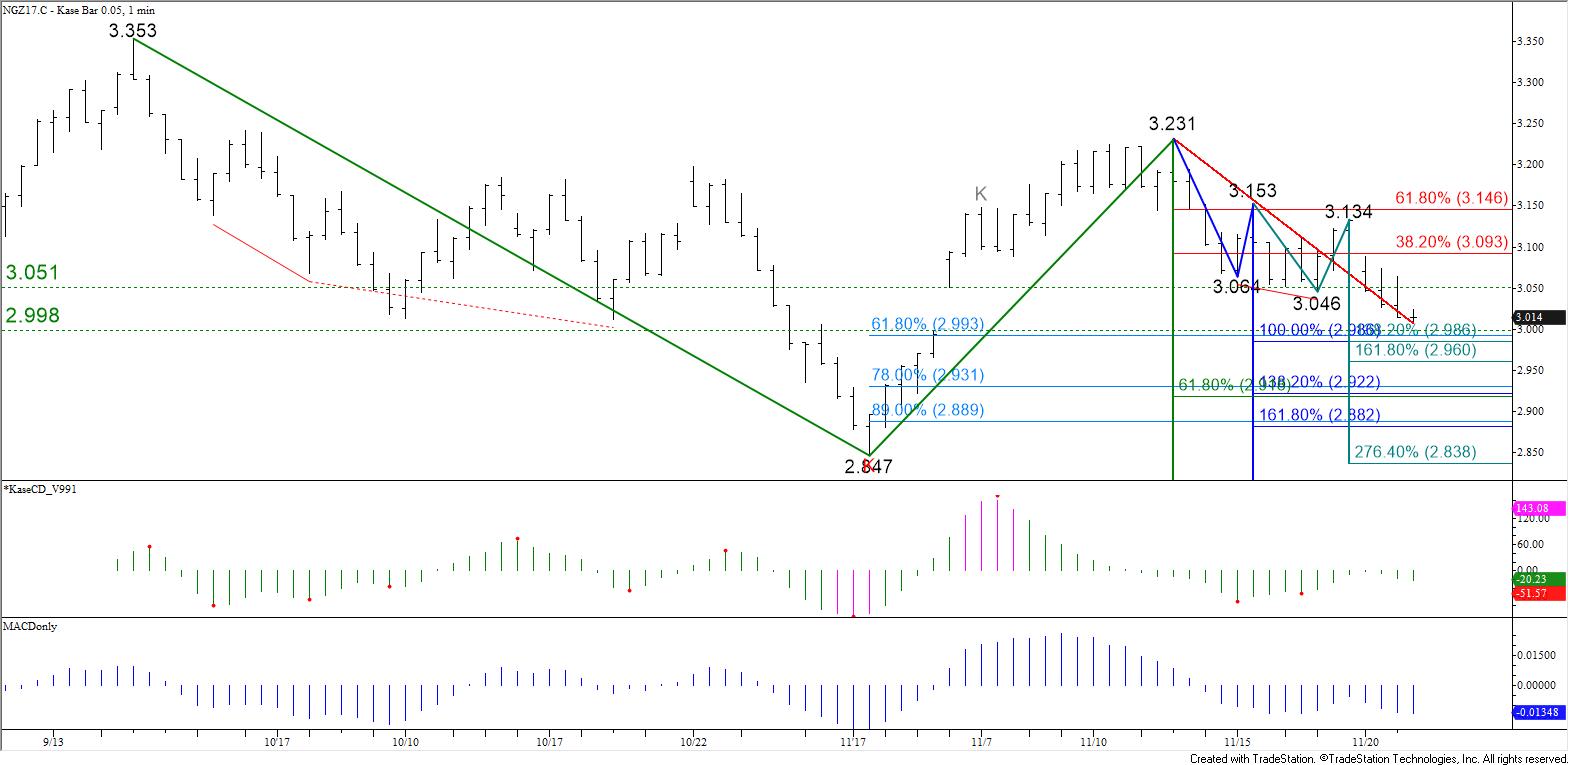
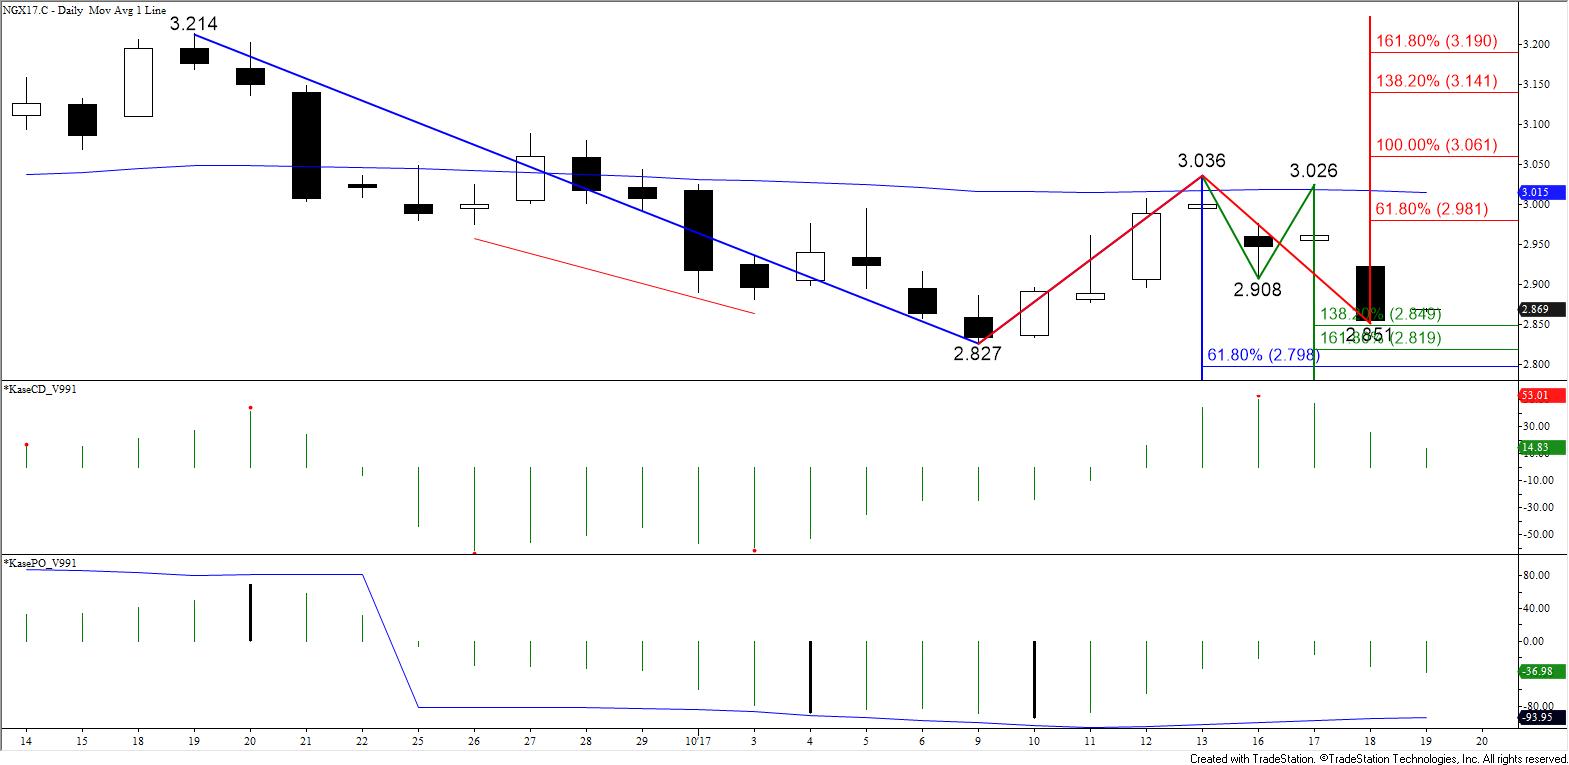
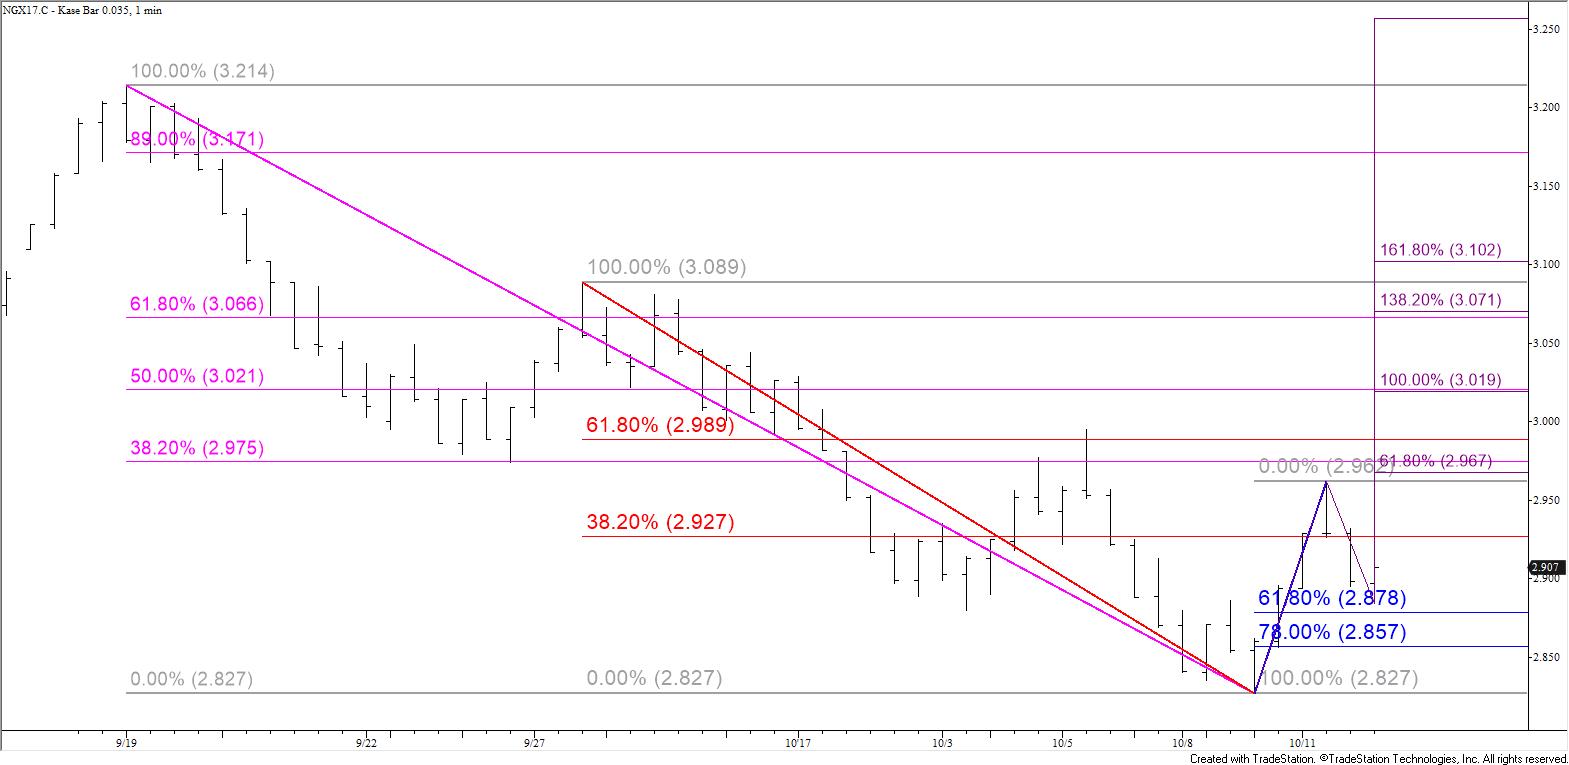
Tomorrow, look for a test of $2.99, a close below which would open the way for key lower support at $2.92. This is the next most confluent target below $2.99 and is most importantly the smaller than (0.618) target of the wave $3.353 – 2.847 – 3.231. The equal to target for this wave is $2.73, which means a close below $2.92 would put odds in favor of falling toward $2.73 during the next few weeks.

Should the bottom of December’s gap at $2.998 continue to hold on a closing basis, there is still a chance for a recovery. Initial resistance is $3.06 followed by $3.10. Key resistance is $3.15. This is in line with the $3.153 swing high, the 62 percent retracement of the decline from $3.231, and the 100-day moving average. At this point, December will have to settle above $3.153 to feel confident that this most recent move down is over.

This is a brief analysis for the next day or so. Our weekly Crude Oil and Natural Gas Commentaries and daily updates are much more detailed and thorough energy price forecasts that cover key futures contracts, calendar spreads, and ETFs. If you are interested in learning more, please sign up for a complimentary four-week trial.

Monday’s gap up from $2.998 is probably a bullish breakaway gap for December natural gas. This is a reversal pattern that takes place after a prolonged down move or consolidation period. Breakaway gaps are also a good sign that a new trend has possibly begun. This type of gap is not usually filled like common gaps. However, in rare cases the breakaway gap may be filled and the new upward trend remain intact.

Today’s settle above the 100-day moving average, 62 percent retracement of the decline from $3.353, and $3.17 confluence point was positive for the medium-term outlook. The move up should grind its way higher to $3.20 and possibly $3.24 over the next few days. However, there are a few warning signs that indicate caution is warranted.

Natural Gas Retracements and Moving Averages

The move up stalled at $3.19, the 38 percent retracement of the decline from $3.747, and still looks a bit exhausted. This afternoon’s late pullback, intraday bearish divergences, and overbought daily Stochastic indicate a larger pullback might take place soon.

With all factors considered, even if a larger pullback takes place support at $3.06 is expected to hold. This would only be a 38 percent retracement of the move up from $2.847, which is considered a “normal” correction. This may even be healthy for the prospects of a longer-term recovery as it could bring in a new wave of value seeking buyers. It would also setup a wave up from $2.847 with which more meaningful confluence points could be projected.

The key to sustaining a positive outlook is holding the bottom of Monday’s gap up from $2.998. Closing below this, which in this case is also near the 62 percent retracement of the move up from $2.847 to $3.190, would indicate the move up has failed again and shift near-term odds back in favor of continued decline.

This is a brief analysis for the next day or so. Our weekly Natural Gas Commentary and daily updates are much more detailed and thorough energy price forecasts that cover key natural gas futures contracts, calendar spreads, the UNG ETF, and several electricity contracts. If you are interested in learning more, please sign up for a complimentary four-week trial.

The long-term outlook for WTI crude oil remains bullish and any move down will most likely be corrective. However, the move up has reached an area of significant resistance between $57.2 and $60.0 for the December contract. Many of the largest waves up from this summer’s $43.08 swing low project to targets within this range. There are no factors that indicate the move up will end, but the confluence of resistance within this range, overbought daily and weekly momentum, and the formation of a daily bearish Harami line and star indicate a corrective pullback should take place as early as tomorrow.

WTI Crude Oil Daily Candlesticks and Wave Projections

The late move below the $56.89 swing low opens the way for at least $56.6. This is the Harami line and star’s completion point and equal to (1.00) target of the wave $57.69 – 56.89 – 57.44. A move below this would call for $56.1, the star’s confirmation point and the larger than (1.618) target of the wave down from $57.69. For now, $56.1 will probably hold, but settling below this would shift odds in favor of a larger downward correction to $55.2 and possibly $54.7 before the move up continues toward $60.0.

For today’s small move down to continue the $57.44 swing high must hold. A move above this would take out the wave down from $57.69 that projects to $56.6 and lower. This would also call for a test of $58.1. A close above $58.1 would put near-term odds back in favor of $58.5 and $59.0. Both are important projections for the waves up from $46.59 and $43.08, respectively.

This is a brief analysis for the next day or so. Our weekly Crude Oil Commentary and daily updates are much more detailed and thorough energy price forecasts that cover WTI, Brent, RBOB Gasoline, Diesel, and spreads. If you are interested in learning more, please sign up for a complimentary four-week trial.

December natural gas fulfilled the equal to (1.00) target of the wave $3.353 – 3.013 – 3.198 when it fell to $2.847 today. Aside from a few brief declines to targets around $2.75, support around $2.86 has been troublesome on the continuation chart since late June. Technical factors indicate this may prove to be strong support for the December contract too.

It is much too soon to definitively state that the move down is over or even that a major correction is underway. However, the small move up from $2.847 formed a daily morning star and hammer reversal pattern setup that would be completed upon a close over Tuesday’s $2.942 midpoint. This is also near the larger than (1.618) projection of the small intraday wave $2.847 – 2.896 – 2.866. Also, the KasePO and Slow Stochastic are oversold and setup for bullish reversal patterns. Even the RSI is nearly oversold.

Natural Gas Daily Candlesticks

The challenge is that all of these positive factors are just setups at this point. Prices will need to settle above at least $2.95 to show that a meaningful correction is underway. Settling above $2.95 (more specifically, $2.945) would open the way for $2.99, the morning star and hammer’s confirmation point and the 38 percent retracement of the decline from $3.198 to $2.847.

If the move down is going to continue this week, a normal correction should hold $2.99. Otherwise, a close above this would call for a test of key near-term resistance at $3.05. This objective is split between the 62 percent retracement of the decline from $3.198 and the 38 percent retracement of the decline from $3.353. A close above $3.05 would not prove that the move down is over, but would provide a technical spark for a much more serious test of resistance that could ultimately lead to a recovery.

All of that said, the larger scale trend is still negative and longer-term odds ultimately favor a continued decline. Therefore, the anticipated move up to at least $2.95 and possibly higher will most likely be corrective. In addition, should prices fall below the $2.866, the wave up from $2.847 that projects to $2.95 and higher would be taken out. In this case, near-term odds will shift back in favor of $2.82 and ultimately $2.75, the next major objective below $2.86.

This is a brief analysis for the next day or so. Our weekly Natural Gas Commentary and daily updates are much more detailed and thorough energy price forecasts that cover key natural gas futures contracts, calendar spreads, the UNG ETF, and several electricity contracts. If you are interested in learning more, please sign up for a complimentary four-week trial.

December WTI crude oil had a legitimate chance for the corrective move down from $54.46 to extend today after setting up a daily evening star and intraday head and shoulders formation. However, support held, and prices rose at the end of the day, settling above the key $54.2 target and opening the way for $55.0 and higher tomorrow.

The next major confluence point is $56.0, the equal to (1.00) target of the wave $46.59 – 53.11 – 49.44, and the larger than (1.618) target of the wave $49.44 – 52.65 – 50.87. Small pullbacks will likely take place before $56.0 is met. Once this objective is overcome look for $56.4 and likely $57.2, the intermediate (1.382) target of the wave $43.08 – 50.72 – 46.59.

WTI Crude Oil
WTI Crude Oil

Resistance at $54.2 has now become support that will likely hold tomorrow. A move below this would call for $53.8 and possibly $53.4, last Friday’s midpoint. Settling below $53.4 is unlikely over the next few days but would indicate a larger correction is underway before the move up continues to $56.0 and possibly higher.

This is a brief analysis for the next day or so. Our weekly Crude Oil Commentary and daily updates are much more detailed and thorough energy price forecasts that cover WTI, Brent, RBOB Gasoline, Diesel, and spreads. If you are interested in learning more, please sign up for a complimentary four-week trial.

November natural gas met support at $2.85, the intermediate (1.382) target of the wave $3.036 – 2.908 – 3.026. This wave is now in position to extend to its $2.81 larger than (1.618) target. This is an important objective because it is also the smaller than (0.618) target of the waves $3.214 – 2.827 – 3.036 and $3.561 – 2.886 – 3.214. Settling below $2.81 would open the way for a more negative near-term outlook.

Due to the confluence and importance of $2.81, once this target is met there is a reasonable chance another test of resistance will take place before prices fall much lower. Initial resistance is $2.89 and then $2.92. A normal correction should hold $2.92 because this is the 38 percent retracement of the decline from $3.036.

Natural Gas Daily Chart

Key resistance for the near-term is $2.97, the 62 percent retracement. A close above this would call for another attempt at $3.02, the 50 percent retracement of the decline from $3.214 and the 50-day moving average.

At this point, aside from confluent support at $3.81, there is very little technical evidence that indicates the move down will end soon. This may change as withdraw season approaches and weather gets cooler. However, for now, odds have shifted back in favor of a continued decline to challenge the continuation charts $2.753 swing low.

This is a brief analysis for the next day or so. Our weekly Natural Gas Commentary and daily updates are much more detailed and thorough energy price forecasts that cover key natural gas futures contracts, calendar spreads, the UNG ETF, and several electricity contracts. If you are interested in learning more, please sign up for a complimentary four-week trial.

Many near-term factors are positive for WTI crude oil. Tuesday’s move up confirmed a daily morning star, today’s move settled above the $51.22 swing high, and last week’s $50.5 midpoint has been overcome. These factors call for the move up to continue, but caution is warranted.

WTI met and held the exact 62 percent retracement of the decline from $58.26 to $49.1 when it rose to $51.42 today. This crucial level held again when prices rose to $51.37 ahead of the close.

WTI Crude Oil Kase Bars
WTI Crude Oil $0.35 Kase Bars

Therefore, prices will probably test support at $50.6 before challenging $51.4 again. Key support is $50.1, Tuesday’s midpoint and the 62 percent retracement of the rise from $49.1 to $51.42. A close below this would indicate the move up has failed and that the near-term has readopted a negative outlook.

Should prices settle above $51.4, look for a $52.1 and more likely $52.5 to be met before the end of the week.

This is a brief analysis for the next day or so. Our weekly Crude Oil Commentary and daily updates are much more detailed and thorough energy price forecasts that cover WTI, Brent, RBOB Gasoline, Diesel, and spreads. If you are interested in learning more, please sign up for a complimentary four-week trial.

November natural gas overcame $2.94 but could not settle above this highly confluent threshold. The pullback from $2.962 formed a long upper shadow on the daily chart. Patterns like this that have formed during the past few weeks have been early warnings that the corrective moves up have stalled. This is probably the case again, so odds favor a test of at least $2.86 tomorrow. A close below $2.86 would open the way for $2.82 and more likely $2.79. The key objective is $2.75, which is in line with the continuation chart’s $2.753 swing low.

Natural Gas Kase Bars
Natural Gas $0.035 Kase Bars

That said, support at $2.88, the 62 percent retracement of the move up from $2.827, held this afternoon. Therefore, there is an outside chance that the move up will continue. A move above $2.93 in early trading would open the way for $2.97, which is now the smaller than (0.618) projection of the wave $2.827 – 2.962 – 2.884. This is also near the 38 percent retracement of the decline from $3.214 and the 62 percent retracement from $3.089. A close above $2.97 would call for $3.02, the equal to (1.00) projection, 50 percent retracement from $3.214, and 50-day moving average.

This is a brief analysis for the next day or so. Our weekly Natural Gas Commentary and daily updates are much more detailed and thorough energy price forecasts that cover key natural gas futures contracts, calendar spreads, the UNG ETF, and several electricity contracts. If you are interested in learning more, please sign up for a complimentary four-week trial.

November natural gas’ initial rise to $2.977 overcame Monday’s $2.967 midpoint. However, prices could not close above that level and the subsequent decline has already retraced 50 percent of the move up from $2.88. The candlestick’s long upper shadow indicates today’s move up was most likely a failed attempt to overcome resistance. Therefore, odds still favor a decline. A move below $2.90 early tomorrow would open the way for $2.85.

Natural Gas Daily Candlesticks

That said, a bullish daily KaseCD divergence and rising Stochastic %K-line indicate consolidation and possibly another attempt at $2.98 and higher might take place. $3.02 is most important for the near-term because it is split around the 38 percent retracement of the decline from $3.214, the 62 percent retracement from $3.089 and the 50-day moving average.

To confirm the move down is over (for now), prices must overcome the $3.089 swing high, which is also the 62 percent retracement of the decline from $3.214. This would, in turn, take out the wave $3.214 – 2.974 – 3.089 that projects to $2.85 and lower.

With all factors considered, the market still has a neutral-to-negative near-term outlook. Until external factors can support a sustained recovery, the decline will most likely continue to grind its way lower.

This is a brief analysis for the next day or so. Our weekly Natural Gas Commentary and daily updates are much more detailed and thorough energy price forecasts that cover key natural gas futures contracts, calendar spreads, the UNG ETF, and several electricity contracts. If you are interested in learning more, please sign up for a complimentary four-week trial.

October natural gas’ settle below Monday’s $3.098 midpoint opens the way for a larger correction to at least $3.06. The move down is most likely corrective. However, for the move up to continue over the next few days $3.06 needs to hold. A close below this would not doom the move up but rather indicate that a deeper test of support and possible consolidation will begin to take place.

Natural Gas Wave Projections

Initial resistance is $3.13, the 62 percent retracement of the decline from $3.166, so far. $3.17 is the key threshold for the near-term. A close above this would indicate the corrective pullback is over and that the move up will extend to $3.23. This is currently the most confluent objective making it another potential stalling point.

This is a brief analysis for the next day or so. Our weekly Natural Gas Commentary and daily updates are much more detailed and thorough energy price forecasts that cover key natural gas futures contracts, calendar spreads, the UNG ETF, and several electricity contracts. If you are interested in learning more, please sign up for a complimentary four-week trial.