Live Cattle Forecast: Where’s the Beef Going?

Cows in a high mountain pastureBy Dean Rogers

Who could ever forget the iconic 1984 Wendy’s commercials featuring three little old ladies yelling “where’s the beef?”(If you are too young to remember treat yourself to taking a minute to watch.)

The commercials and the phrase “where’s the beef?” spawned a cultural catchphrase that has since become a statement questioning the value and substance of a product. The value of beef, priced in live cattle futures, has tripled since 1984, but a downturn in prices over the past 10 months begs the question, “where’s the beef going?”

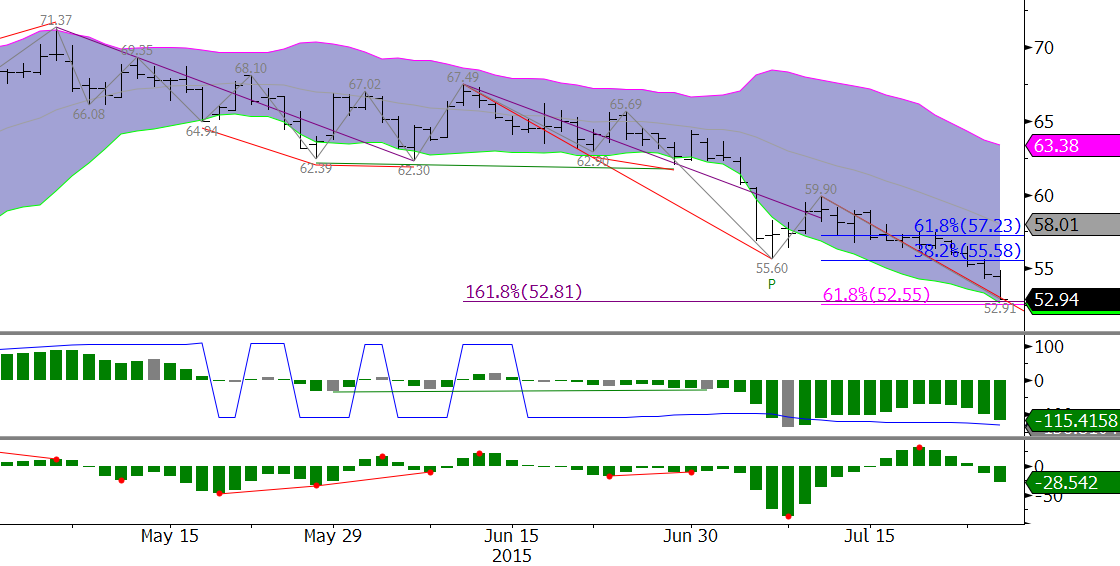
On October 31, 2014 the perpetual (first nearby) live cattle futures contract rose to an all-time high of 171.975 cents per pound. Since then, prices have fallen in a corrective manner and recently came very close to meeting major support at 141.35. This is a highly confluent target that serves as a series of Fibonacci projections for the waves down from 171.975 (blue), 164.25 (green), and 156.475 (red) as shown in the chart below.

live cattle support

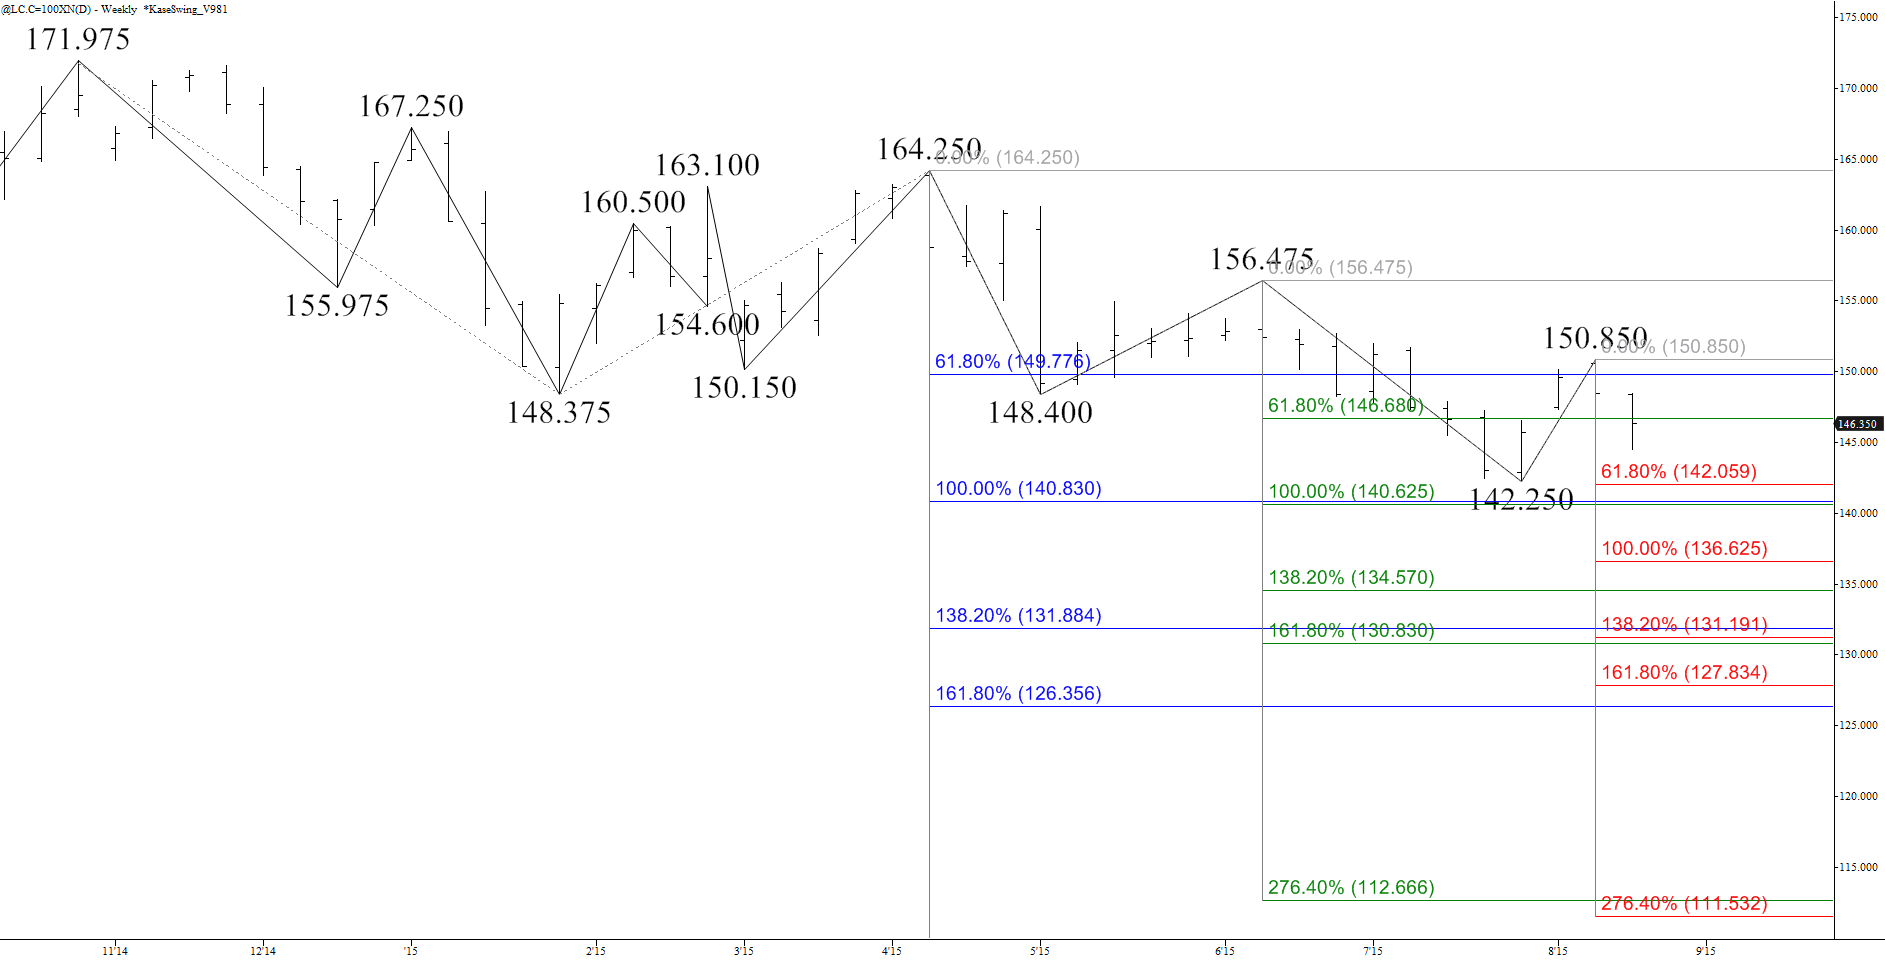
A close below 141.35 would open the way for the decline to continue to at least 135.6 and very likely 131.4. The latter is another highly confluent wave projection and potential stalling point, but the key target for live cattle futures is 127.0. This is the 1.618 projection of the largest and most important wave down from 171.975 (blue) and the more recent wave from 156.475 (red).

The decline from 171.975 is no doubt a correction of the long-term move up, and corrections normally hold the 1.618 target. Therefore, we expect to see a significant pullback and potential bottom form at 127.0. However, a sustained close below this would open the way for an extended decline to 122.05 and possibly 112.0.

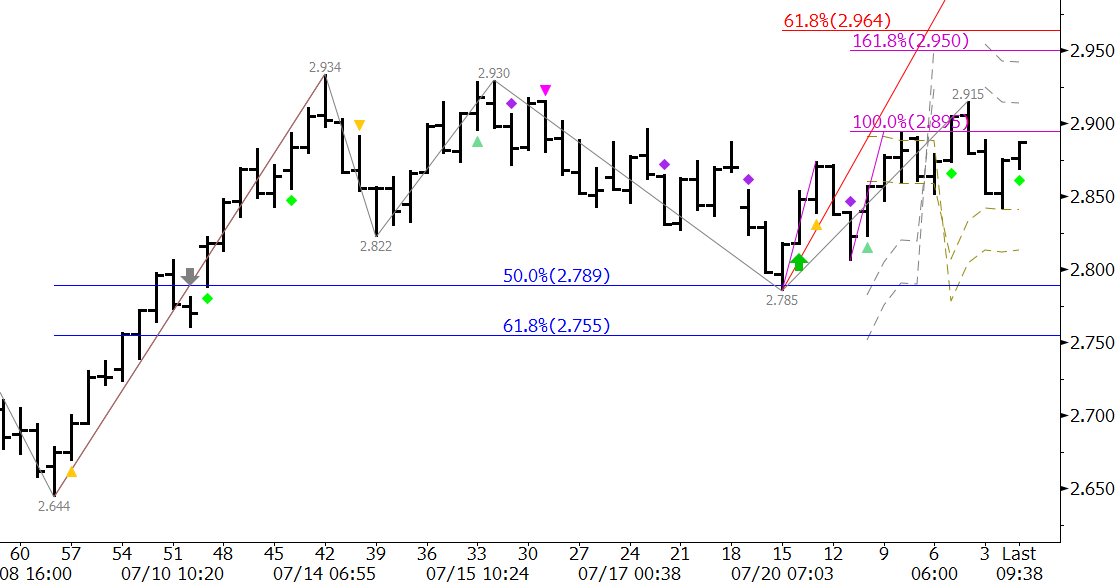
The decline has stalled at 142.25 for now, and so far the subsequent rise to 150.85 is most likely a small correction of the move down (yes we are talking about corrections of corrections). The recent move up is most likely being driven by a typical seasonal boost for beef ahead of Labor Day.

The upward correction may extend, but 153.4, the 1.00 projection of the wave up from 142.25 (pink) and the 38 percent retracement of the decline from 171.975 should hold. The connection to 153.4 is made through the 0.618 projection of 149.8.

live cattle resistance

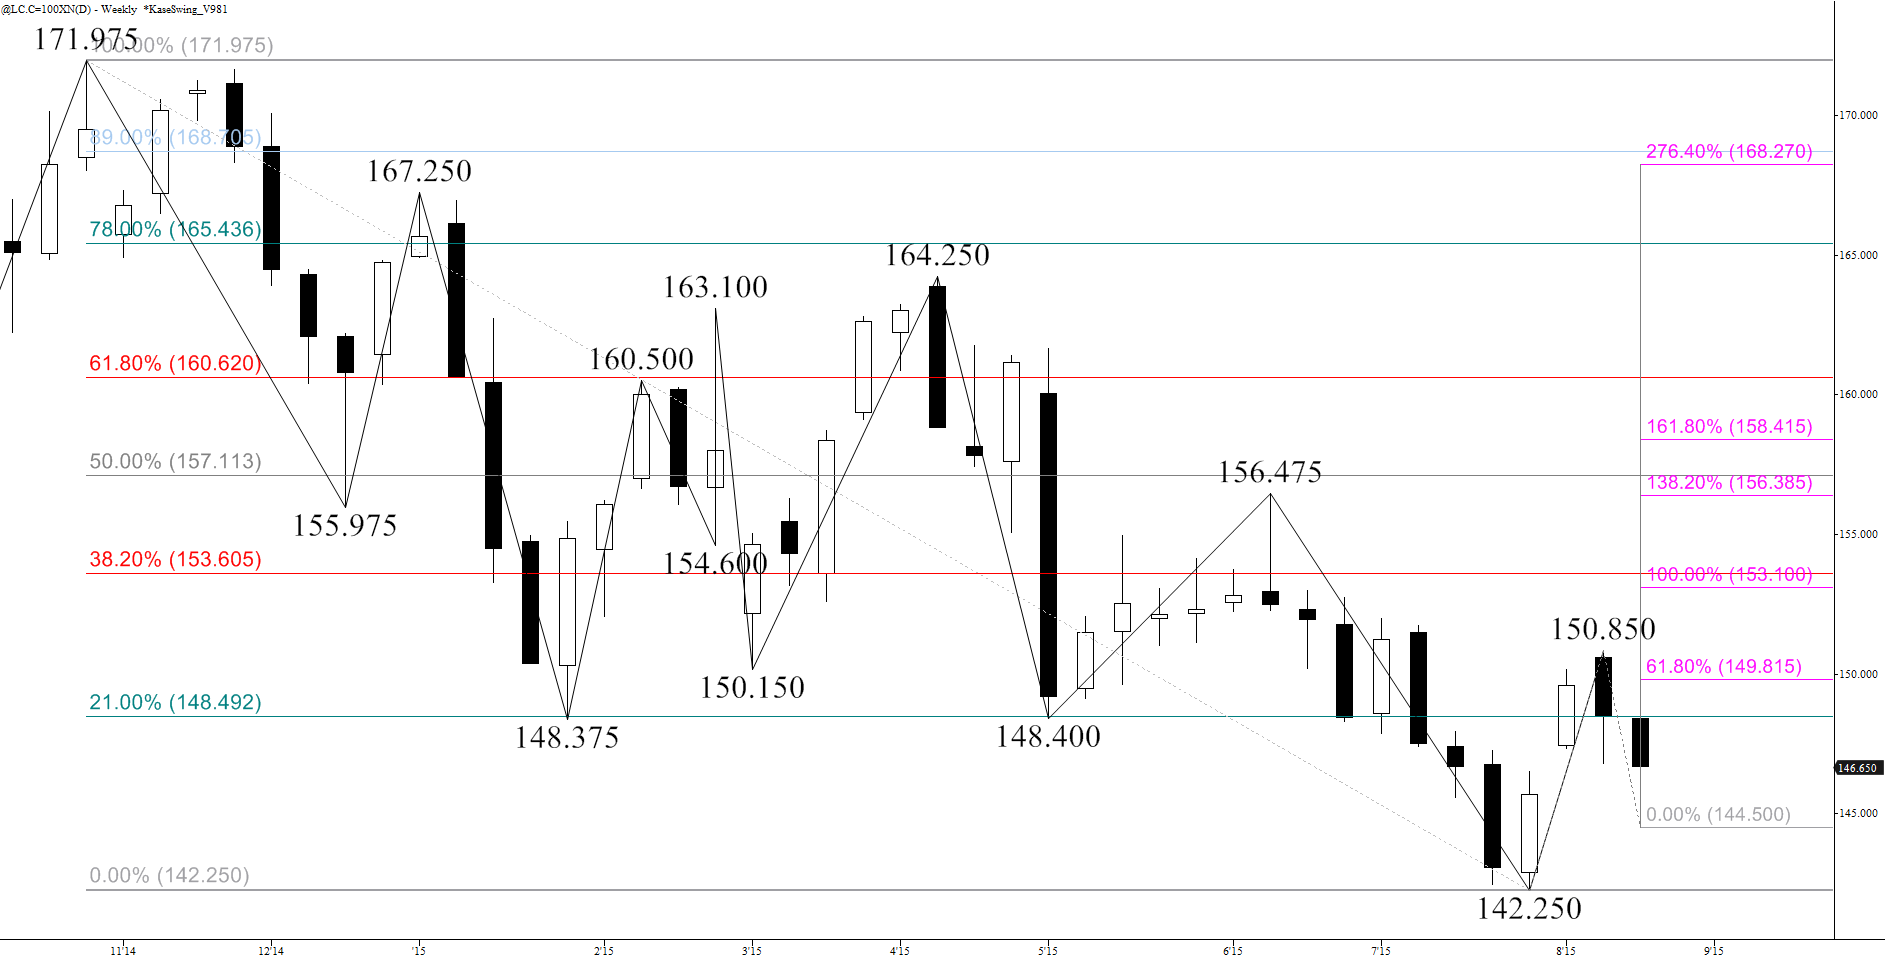
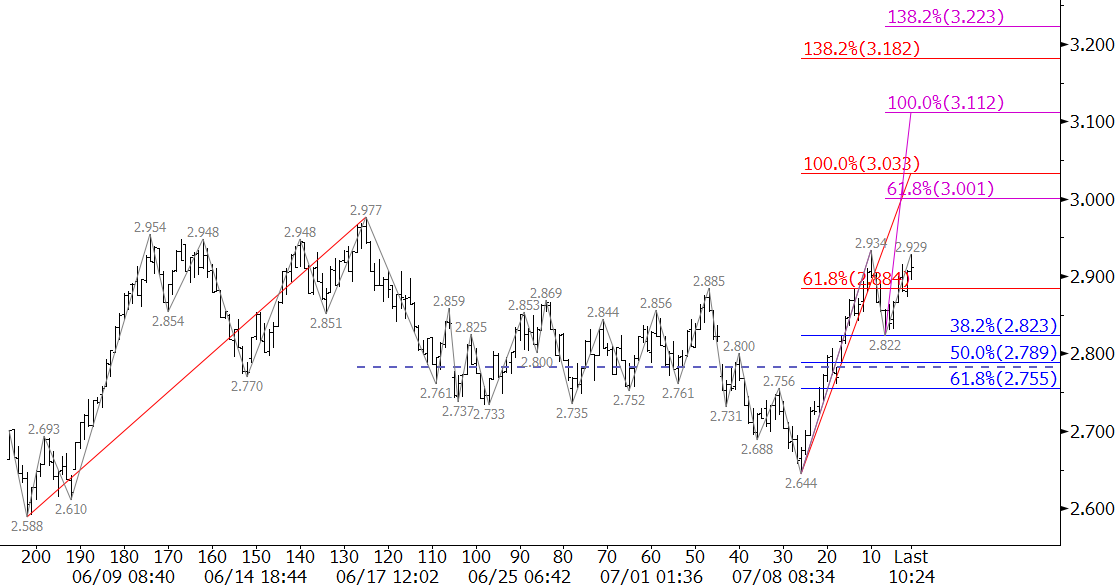
Based upon most technical factors as of this analysis, we don’t expect to see prices rise much higher than 153.4. This is a very important level not only because it is a confluent retracement and wave projection, but it also protects the 156.475 swing high. A move above 156.475 would take out of the waves down from this swing high and from 164.25. As a result the likelihood of a decline to or below 141.35 would be significantly dampened.

Therefore, upon a close over 153.4 odds would shift in favor of an extended upward correction to 156.8 and likely 159.5, a crucial target because it is split between the 1.618 projection of the wave up from 142.25 and the 62 percent retracement of the decline from 171.975. A sustained close over 159.5 would indicate the decline from 171.975 is over and would call for 168.5 and higher.

So to answer the question “where’s the beef going?”; technical factors show that prices will most likely fall once the Labor Day demand boost passes. Look for resistance at 153.4 to hold and for 141.35 to be challenged again. A close below 141.35 will call for 135.6, 131.4, and 127.0.

Check out Kase on Technical Analysis to learn more about trading and forecasting price using technical analysis.

Charts created using TradeStation. ©TradeStation Technologies, Inc. 2001-2015. All rights reserved. No investment or trading advice, recommendation or opinions are being given or intended.

By Dean Rogers

For most of 2015 natural gas has traded within a range between $2.65 and $2.95, and within the past week prices have tested both the upper and lower boundaries of the range. After failing to overcome $2.95 and stalling at $2.934 on August 12, prices declined to $2.68 on August 18, a confluent target for the waves down from $2.957 and $2.934.

Technical and fundamental factors favor a continued decline below the $2.65 boundary of the range to at least $2.60. This is another confluent target and a close below $2.60 would confirm the break lower out of the trading range.

natural gas

Wednesday’s bullish Harami land and star setup indicates that the upward correction from $2.68 might extend to $2.776 and possibly $2.834 first. These are the 38 and 62 percent retracement of the move down from $2.934. Resistance at $2.776 should hold, but $2.834 is the threshold for another attempt to overcome $2.95.

Overall, the bias is negative. The move down may be a grind lower for now, but time is running short for summer weather to continue to support prices above $2.65. Last week’s push to $2.934 may have been the last hurrah, and the move down is now poised to continue.

This is a brief natural gas forecast ahead of tomorrow’s EIA report. Our weekly Natural Gas Commentary is a much more detailed and thorough analysis. If you are interested in learning more, please sign up for a complimentary four week trial.

disney
By Cynthia Kase

Read on TraderPlanet.com

“Ask Kase” and your question may be chosen as the subject of a future column (askkase@kaseco.com).

The media sector has been hit by fears about streaming video and unbundling. Disney reported decent revenues, but is trading at a relatively high multiple. With high hopes that Star Wars will boost Disney’s stock price, is the decline now a time to buy in?

Disney climbed from a $15.14 low back in 2009 to a $122.08 high on August 4, only to suffer an $11 plus down gap on the following day’s open. This precipitous drop, continuing to $104.24, disconnected the following price action from the previous uptrend. Though the dropped seemed large, it only retraced 38 percent of the rise from $78.54.

Aside from waves, the only key pattern is an intraday coil, shown in the chart below (dark red). Though coils are signs of uncertainty, this one appears to be a failed attempt to recover. The last wave up in green would be expected to exceed the earlier one, which did not happen

$0.75 Kase Bar with Coil

DIS Kase Bar Chart

Charts created using TradeStation. ©TradeStation Technologies, Inc. 2001-2015. All rights reserved. No investment or trading advice, recommendation or opinions are being given or intended.

If there’s a break higher, though, I’d buy above $111 and increase my position above $117.9. Otherwise, I’d watch $100. If it doesn’t break, then I would time in on signals as prices rise from a short-lived downside test. I would buy on a bounce up from $93.4. But if this lower “drop dead” support breaks, I’d watch Fantasia instead of DIS for now.

Here are the details. As the coil’s apex is approached, a breakout is expected, with upside and downside targets $117.9 and $97.8 respectively.

The decline stalled before hitting its 21 percent retracement, $100. This is a hugely important price because it is the first retracement of the entire move up.

Retracements to $122.08

DIS Retracements

$100 is also a key extension for the waves marked in magenta in the chart. The wave from $122.08 extends to $100 as its 0.62 projection, and the Phi corrective projection. The 1.62 extension for this wave is $93.4.

The magenta wave down from $111 extends to $100 as its 1.38 projection. The last small wave from $109.28 targets $100 as its 2*1.38 extension. (For more on wave targets, check out Kase on Technical Analysis).

The waves shown in blue calculate to immediate support at $101.5. This is also Kase DevStop3 on the weekly chart. If this level isn’t broken on a move lower, then the tone will improve. It’s likely though, if this is tested, $100 will be met. $100 is also a psychological barrier.

Below $100, there’s a wave projection to $97.6, the coil’s lower target, but a break of $100 will likely lead to the $93.4 confluence point.

On the upside, the recent $111 swing poses initial resistance both structurally and as a wave target. Above this there’s a confluence point at $114.9, but the big number is $117.9, coincident with the coil’s upper target. Above this, a resumption of the uptrend would be expected, with reasonably confluent targets up to about $133.

Send questions for next week to askkase@kaseco.com, and learn more about Kase’s services please visit here.

By Dean Rogers

For several weeks natural gas has been trading within a range bound between $2.65 and $2.95, and more recently between $2.71 and $2.88. On Wednesday natural gas prices closed at the highest level since May 21 at $2.931, and the first class KEES permissions (blue dots) confirm the positive tone. Natural gas futures are now poised to overcome $2.95 and challenge $3.00. This is a confluent projection for the waves up from $2.656 and $2.706.

natural gas

A close over $3.00 will open the way for an extended upward correction, but keep in mind, this rally may be short lived as the end of summer and its warm weather are rapidly approaching. This upward correction may very well be the last hurrah before the end of summer, and it is going to be a lot easier for longer-term bears to short from $3.00 versus $2.70.

In addition, not only is the market is nearing a past failure point at $2.95, but both the KaseCD and KasePO momentum indicators are setup for bearish divergence. This is a signal that forms when higher price highs are accompanied by lower momentum highs. Bearish divergence is a signal that indicates the move up is exhausted.

Should price turn lower look for support at $2.85 and $2.70. These are the 38 and 62 percent retracements of the move up from $2.706 to $2.934.

This is a brief natural gas forecast ahead of tomorrow’s EIA report. Our weekly Natural Gas Commentary is a much more detailed and thorough analysis. If you are interested in learning more, please sign up for a complimentary four week trial. We also offer trials of our trading indicators.

By Big Hotel ImageCynthia Kase

Read on TraderPlanet.com

The big hotel chains recovered from the financial crisis well and until recent months showed steady gains. Diversification, appealing to differing guests, as well as shifting property ownership to partners helped heat the sector. But now, it looks like supply is catching up with demand, and now the sector is cooling off. To evaluate specifics, I’ve chosen to look at Starwood Hotels & Resorts Worldwide Inc. (HOT) this week as a proxy for its peers.

HOT’s been down for four months running, having lost about 14 percent of its value. The first major downside target is $73.0. If that breaks, a freefall to $65 could ensue, but $70, or $67.5 form interim support. These prices are reflected in the retracement tables shown below

Big Hotel Small Chart
Retracements from Lows to $87.99


Since Friday, there’s been a small correction, but HOT declined today, August 11. $78 could be tested, and a close over next resistance at $81 would call for a recovery.

Starwood (HOT) Technical Indicators

Looking at the technicals, Starwood’s monthly chart generated a negative divergence back in April based on the KaseCD. Four down months have followed, but lows have not yet reached Kase’s first stop level at $72.83. The stop is near a key target, centered on $73.Big Hotel Chart

The first wave of a pattern is always the most important. Here that’s 87.99 – 79.53 – 86.96, the 1.62 extension for which is $73. If the pattern extends, look for $65, the trend terminus. This is just above Kase’s second stop at $65.8. The most recent wave is 87.99 – 79.53 – 86.96, and $73 is its equal extension as well as the Phi-squared corrective projection.

Backtracking, July 31 was an aberrant, outside, down day. Prices spiked to $86.96 only make a $77.72 low. $73 and $65 are targeted by this day’s waves.

The last four days through Tuesday for a Harami line with stars. The daily chart is oversold, but not divergent. Prices rose about $1.50 from $75.57, but fell today. The wave up targets $78, which is its equal extension, as well as its Phi corrective projection. The wave also targets $81, using three different calculations. This is the “drop dead” price above which the tone becomes positive, and the highest price to which the small wave projects. These two resistance values are the midpoints for the August (so far) and July monthly candlesticks.

Recommended Starwood (HOT) Trading

If I were short above $86, I’d just stay short, perhaps scaling out at $78 and then $81, and exercising caution at the downside targets. Bearish intraday traders might time in here, but watch $73, and use tighter stops. Technically there is little room for optimism, but if you’re long on fundamentals, then monitor the downside targets. Above $81 – you’re “hot”.

Connect with me on LinkedIn for more Market Updates.

By Dean Rogers

For the past eight weeks September WTI crude oil futures have closed lower, and the decline is quickly approaching major support at $42.5. Many pundits claim the sky is falling, but it is usually at times like this that the market will finally find support and at least attempt to make a bottom.

We have discussed $42.5 as major target and potential bottom in our weekly blog update and in our detailed crude oil forecast for several weeks. There is no definitive evidence that the move down is going to end, but on Monday a few positive signs formed that indicate an extended upward correction may take place.

Monday’s bullish engulfing line, exhausted daily KasePO and KaseCD momentum, weekly divergence setups, and the intraday wave up from $43.35 all show that the upward correction may test $45.9 and possibly $47.5 before the decline continues.

wti crude oil

For now, there is no evidence that this will be a major correction, not yet at least, but the fact that the market is starting to show some positive signs of life could mean the move down will end soon.

That said, important resistance was met at $45.01, so we expect to see a pullback to $44.3, Monday’s midpoint, in early trading Tuesday. A close below $44.3 would negate many of the aforementioned positive factors and open the way for $42.5 to finally be met.

This is a brief analysis and outlook for the near-term. Our weekly Crude Oil Commentary is a much more detailed and thorough energy price forecast. If you are interested, please sign up for a complimentary four week trial.

By Dean Rogers

Crude oil has taken on a strong bearish tone. There is very little technical evidence, and even less fundamental evidence, that the decline is going to end. However, it is almost always darkest before dawn and there are a few factors that show a correction should take place soon.

Last week’s update discussed major support at $47.0 for WTI and September Brent crude oil is quickly approaching major technical support at $52.8. This is the 1.618 projection for $71.37 – 62.3 – 62.49, the 0.618 projection for $67.49 – 55.6 – 59.9, and the lower Bollinger Band. The KasePO, shown in the middle panel of the chart above, and KaseCD, in the bottom panel, are setup for divergence and nearly in oversold territory. These factors indicate $52.8 is a potential stalling point and that a correction might take place before the decline continues to the next targets.

Brent

A normal correction will hold $55.6, the 38 percent retracement from $59.9. Key resistance is $57.2, the 62 percent retracement. We expect $55.6 to hold before the next leg lower takes place.

This is a brief analysis and outlook for the near-term. Our weekly Crude Oil Commentary is a much more detailed and thorough energy price forecast. If you are interested, please sign up for a complimentary four week trial.

Natural gas is idling in neutral again and is struggling to overcome key resistance levels. We are still negative for the longer-term, but the near term outlook is looking slightly positive.

The small move up is confirmed by long KaseX signals (green diamonds) on the $0.035 Kase Bar chart. In addition, Wednesday’s close over $2.895, the 1.00 projection for the wave up from $2.785, has opened the way for its 1.618 projection near $2.96. The $2.96 target is crucial because it is the 0.618 projection for the wave up from $2.644. A close over $2.96 would call for an extended correction to targets above $3.00.

natraul gas

Other than the quick move up from $2.644, the recent move up has lacked conviction. A daily evening star setup and hanging man indicates traders are still not quite sure if the market is ready to make the push higher. Tuesday’s $2.84 open is first support, and a close below this would call for another test of the $2.785 swing low.

This is a brief natural gas forecast ahead of tomorrow’s EIA report. Our weekly Natural Gas Commentary is a much more detailed and thorough analysis. If you are interested in learning more, please sign up for a complimentary four week trial.

August natural gas is attempting to rally above $3.00 after stalling at $2.644 last Thursday. The surge over the last week may be a desperate attempt to push prices to targets above $3.00 before summer’s end, and is being driven by speculation of above normal temperatures through the end of this month and into August.

The near-term outlook took a positive turn Wednesday when prices closed above $2.884, the 0.618 projection of the wave $2.588 – 2.977- 2.644. This clears the way for a rally to the 1.00 projection of $3.03. This is a potential stalling point for the upward correction. A close over $3.03 would call for the $3.20 confluence point with intermediate resistance at $3.11.

natural gas

Caution is warranted though because it is a bit early to get overly exuberant about a bullish recovery. The balance of bullish and bearish factors is razor thin and shifts day-to-day. The move up is almost certainly corrective of the longer-term decline. Do not be surprised to see prices pull back and settle below $2.82 on Thursday should there be a disappointing EIA storage report. This, in turn, would call for $2.75 and lower.

This is a brief natural gas forecast ahead of tomorrow’s EIA report. Our weekly Natural Gas Commentary is a much more detailed and thorough analysis. If you are interested in learning more, please sign up for a complimentary four week trial.

Perfect geometric formations are a rare commodity. They are useful gems of information that can tell us a lot about a market’s outlook and general direction. It is important to pay attention to the implications of a successful break out of the pattern, and it is even more important to watch for patterns that fail.

WTI’s bearish flag on the $0.50 Kase Bar chart is as close to a textbook example as one will ever see. Flags are extremely reliable continuation patterns. Because this flag formed after a decline, and is sloping upwards, it is a bearish pattern that indicates the move up is corrective and that the decline should continue.

WTI Crude Oil

The waves within the flag have fulfilled the 1.00 projection for the wave $50.58 – 53.43 – 50.91. This is significant because it is evidence that the move up is unfolding as a three-wave ABC pattern, which is more evidence that the move is corrective.

Prices settled in the lower half of the formation on Monday, which does not bode well for another test of the upper trend line. A close below $51.8, which is near the bottom trend line, would indicate the move down is going to extend to at least $49.9. Our detailed weekly analysis discusses the connections to targets in the mid- to low-$40s upon a break lower.

There is an outside chance that the formation will fail, but prices will need to close over $54.8 to prove that an extended upward correction and potential recovery is underway. Technically, the flag will fail upon a close over the upper trend line, which is currently $54.2. However, for many technical reasons, $54.8 is the threshold for a positive near-term outlook. Most importantly, it is near the 38 percent retracement of the decline from $62.22 and the midpoint of July 6th.

For now, watch the flag formation closely. Odds favor a break lower and close below $51.8. The directional breakout of this pattern will be a strong clue as to the direction of WTI for the next several weeks.

This is a brief analysis and outlook for the near-term. Our weekly Crude Oil Commentary is a much more detailed and thorough energy price forecast. If you are interested, please sign up for a complimentary four week trial.