Natural Gas Forecast: Pullback Will Test Major Support at $1.74

By Dean Rogers

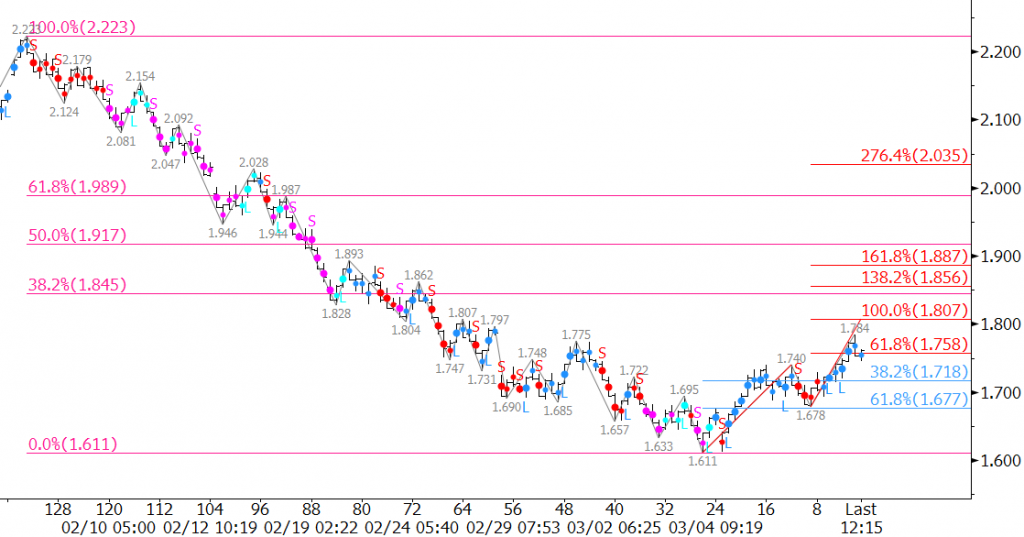
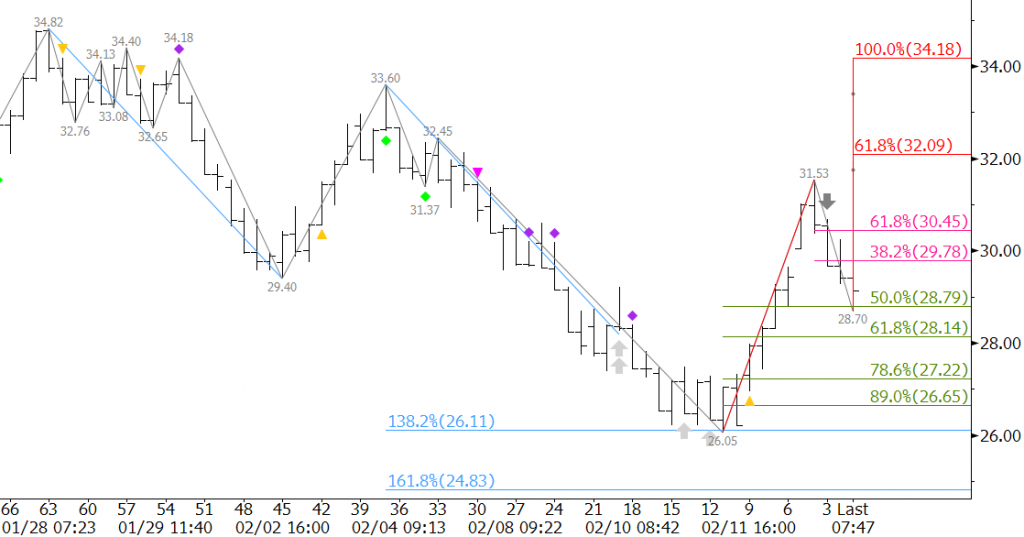
It looks as though the natural gas rally has stalled and that prices will most likely settle into a trading range. The move up had been resilient for the past few weeks, reaching a crucial target at $1.91 and nearly extending to key resistance just above $2.00. However, the lack of a positive shift in underlying fundamentals has put a lid on prices, for now.

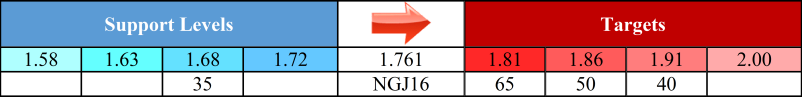
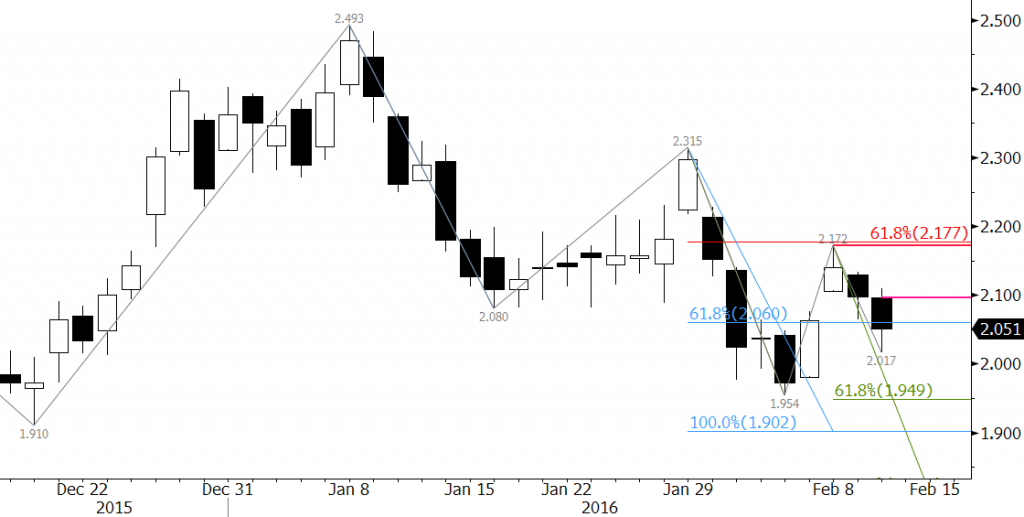
April natural gas is poised to test key support at $1.74 ahead of the holiday weekend. Wednesday’s close below $1.80, the 0.168 projection of the wave $1.957 – 1.796 – 1.899, has shifted odds strongly in favor of at least $1.74, the 1.00 projection. This is also the 62 percent retracement of the move up from $1.611 to $1.957. A close below $1.74 would call for $1.68 and very likely $1.65. The latter is the 1.618 projection, 89 percent retracement, and last support protecting the $1.611 low.

NGJ6 20160323

Longer-term, the outlook for natural gas remains bearish. However, we do not foresee prices making new lows yet. The most likely scenario, during the first few weeks of injection season, is a trading range between nominally $1.65 and $1.95. This is similar to the type of range seen last year between $2.55 and $2.95.

There is a reasonable chance that prices will test Wednesday’s $1.83 midpoint before declining to $1.74. This is also the 38 percent retracement of the move down from $1.899. A close over $1.83 would call for $1.90 again. This is key resistance because a move above $1.90 would wipe out the wave down from $1.957 and its potential to extend to $1.74 and lower.

This is a brief natural gas forecast for the next day or so. Our weekly Natural Gas Commentary is a much more detailed and thorough analysis. If you are interested in learning more, please sign up for a complimentary four-week trial.

WTI’s move up has been resilient for the past few weeks. The waves up from $29.85 may be interpreted as either a five-wave trend that is still forming Wave III or a three wave correction that has nearly completed Wave C. Technical factors indicate May WTI is approaching a decision point at $43.1.

In either case, whether the move is five waves or three waves, Wave A or I should meet the 1.618 projection at $43.1. A correction should then take place. The correction will determine whether or not the move up is a five-wave trend.

CLK6 20160321

Key support will be $38.0. This is the 38 percent retracement and is in line with the $37.52 swing high of Wave A or I.

A close below $38.0 would indicate the move up from $29.85 was a three wave correction. There is no evidence yet that prices will plummet to new lows. Therefore, upon a close below $38.0, a trading range in the mid-$30 is the most likely scenario.

Should prices hold above $38.0 and subsequently close over $43.1, the move up is most likely a five-wave pattern that will extend toward the 2.764 projection of $51.9. A move of this magnitude will take time, and should form another sub five-wave count like Wave III has. It will also likely be backed by a positive shift in underlying fundamentals.

This is a brief analysis and outlook for the next day or so. Our weekly Crude Oil Commentary is a much more detailed and thorough energy price forecast. If you are interested in learning more, please sign up for a complimentary four-week trial.

The highly anticipated natural gas correction is underway. The wave $1.611 – 1.74 – 1.687 overcame its $1.758 0.618 projection Wednesday morning. The correction should extend to at least $1.81, the 1.00 projection. A close over $1.758 would have increased odds for $1.81. Nonetheless, as long as the $1.687 swing low holds on a closing basis the move up should extend.

NGJ6 20160309

$1.81 connects to $1.86 as the 1.382 projection and 38 percent retracement of the decline from $2.223 to $1.611. $1.86 is a potential stalling point due to its confluence. A close over $1.86 would call for $1.91, the 1.618 projection and 50 percent retracement.

NGJ6 Table 20160309

Key resistance is $2.00, the 62 percent retracement. As discussed in the weekly commentary, we doubt prices will overcome $2.00 without a bullish shift in underlying fundamentals.

Key support is $1.68 because it is the 62 percent retracement of the move up from $1.611 and in line with the $1.687 swing low. A close below this would indicate the upward correction may be complete and would significantly dampen odds for $1.81 and higher.

This is a brief natural gas forecast for the next day or so. Our weekly Natural Gas Commentary is a much more detailed and thorough analysis. If you are interested in learning more, please sign up for a complimentary four-week trial.

Crude oil continued to rise on Monday as traders anticipate a production freeze that will be discussed by major producers at a meeting later this month. In addition, US production has started showing signs that it is declining. Caution is warranted because the prices rise has become asymptotic, but most technical factors are positive and call for higher prices over at least the next few days.

April WTI confirmed its $28.75 double bottom with the close over $36.28 on Monday. The double bottom’s target is $43.81. This is now a key objective for the relief rally. However, April must overcome a very important $39.2 target before it can make a serious run at $43.8. Most importantly, $39.2 is in line with the 1.618 projection of the wave $28.74 – 34.21 – 30.56. This is a confluent and crucial target because it protects the psychologically important $40.0 level.

CLJ6 20160307

Tomorrow odds are 75 percent for $38.7 and 65 percent for $39.2. We expect to see a pullback once $39.2 is met. Without further help from underlying fundamentals, WTI may be hard pressed to overcome $39.2 over the next few days.

CLJ6 Table 20160307

Look for support at $37.1 and $36.2. These are Monday’s midpoint and open. $36.2 should hold tomorrow. A close below this has 25 percent odds. This would indicate the move up may be in trouble and that a more significant correction to $35.2 and lower is underway.

This is a brief analysis and outlook for the next day or so. Our weekly Crude Oil Commentary is a much more detailed and thorough energy price forecast. If you are interested in learning more, please sign up for a complimentary four-week trial.

By Dean Rogers

The highly anticipated natural gas correction is underway. The wave $1.611 – 1.74 – 1.687 overcame its $1.758 0.618 projection Wednesday morning. The correction should extend to at least $1.81, the 1.00 projection. A close over $1.758 would have increased odds for $1.81. Nonetheless, as long as the $1.687 swing low holds on a closing basis the move up should extend.

NGJ6 20160309

$1.81 connects to $1.86 as the 1.382 projection and 38 percent retracement of the decline from $2.223 to $1.611. $1.86 is a potential stalling point due to its confluence. A close over $1.86 would call for $1.91, the 1.618 projection and 50 percent retracement.

NGJ6 Table 20160309

Key resistance is $2.00, the 62 percent retracement. As discussed in the weekly commentary, we doubt prices will overcome $2.00 without a bullish shift in underlying fundamentals.

Key support is $1.68 because it is the 62 percent retracement of the move up from $1.611 and in line with the $1.687 swing low. A close below this would indicate the upward correction may be complete and would significantly dampen odds for $1.81 and higher.

This is a brief natural gas forecast for the next day or so. Our weekly Natural Gas Commentary is a much more detailed and thorough analysis. If you are interested in learning more, please sign up for a complimentary four-week trial.

By Dean Rogers

Crude oil continued to rise on Monday as traders anticipate a production freeze that will be discussed by major producers at a meeting later this month. In addition, US production has started showing signs that it is declining. Caution is warranted because the prices rise has become asymptotic, but most technical factors are positive and call for higher prices over at least the next few days.

April WTI confirmed its $28.75 double bottom with the close over $36.28 on Monday. The double bottom’s target is $43.81. This is now a key objective for the relief rally. However, April must overcome a very important $39.2 target before it can make a serious run at $43.8. Most importantly, $39.2 is in line with the 1.618 projection of the wave $28.74 – 34.21 – 30.56. This is a confluent and crucial target because it protects the psychologically important $40.0 level.

CLJ6 20160307

Tomorrow odds are 75 percent for $38.7 and 65 percent for $39.2. We expect to see a pullback once $39.2 is met. Without further help from underlying fundamentals, WTI may be hard pressed to overcome $39.2 over the next few days.

CLJ6 Table 20160307

Look for support at $37.1 and $36.2. These are Monday’s midpoint and open. $36.2 should hold tomorrow. A close below this has 25 percent odds. This would indicate the move up may be in trouble and that a more significant correction to $35.2 and lower is underway.

This is a brief analysis and outlook for the next day or so. Our weekly Crude Oil Commentary is a much more detailed and thorough energy price forecast. If you are interested in learning more, please sign up for a complimentary four-week trial.

Spot Gold (XAU)
The long-term outlook for gold is still reasonably promising after prices rallied from a six-year low in December. However, from a technical standpoint, the decline from the 1263.48 swing high is poised to challenge support targets before the move up continues.

KaseX triggered a strong short entry signal called a pierced dart (gray down arrow and yellow triangle) on February 15. On that same day a bearish Harami line and star was completed. The subsequent pullback to 1240.02 held the 1263.48 swing high and was followed by a confirming short signal on Monday, February 22. Monday’s decline also completed another bearish Harami line and star. These factors call for the decline to continue for the near-term.

Gold Daily Candlestick ChartGold Chart

The primary wave that the move down formed, 1263.48 – 1191.02 – 1240.02, projects to 1194.5 as the 0.618 target. Most waves that meet the 0.618 projection extend to at least the 1.00 projection, which in this case is near the 1163.6 confluence point. 1163.6 is the decision point for a larger correction to 1126.2 and possibly lower. A close below 1163.6 would significantly dampen the likelihood of a continued rise, and a close below 1126.2 would shift the long-term outlook to negative.

Gold Table

First resistance is 1232.3. This is currently the 0.618 projection of the small wave up from 1191.02. A close over this would call for 1251.1, the 1.00 projection. As it stands, odds are 25 percent for a close over 1251.1 before at least 1194.5 is met. A close over 1251.1 would indicate that the move up should extend to at least 1277.1 and possibly 1331.0 and higher.

S&P 500 Index (SPX)

The S&P 500’s rally from a double bottom at 1810.1 has been relatively strong and is challenging the completion point of the formation at 1947.2. This is significant because a close over 1947.2 would complete the double bottom and open the way for a potential rally to the formation’s 2084.0 target.

S&P 500 Index Daily ChartSPX Chart

A similar double bottom had formed in late 2015 and was completed when the index closed over 2020.86. The ensuing move fell short of this double bottom’s 2177.0 target, but was still substantial. We could see a similar type of rally upon a close over 1947.2 that falls short of the 2084 target, but challenges key resistance before the decline continues.

Other technical factors, such as wave projections and retracements, call for at least 1971.6. This then connects to 2019.7, 2057.7, and finally 2084.

SPX Table

The move down stalled just below a key support level at 1849. This was the 1.00 projection of the wave 2134.72 – 1867.01 – 211.48. The index only closed for one day below this level, so this is still crucial support.

A normal correction of the move up should hold 1894.0 and must hold 1862. These are the 38 and 62 percent retracements from 1810.1 to 1946.7. Key support is 1848, and a close below this would shift the outlook back to negative and call for 1810 and lower again.

These are brief technical analyses with a 10-day outlook based upon Kase’s technical forecasting models and trading indicators KaseX and Kase StatWare. If you are interested in taking a trial of KaseX or Kase StatWare please contact sales@kaseco.com. We would love to get your thoughts about the forecasted targets and probabilities. Leave a comment or send them along with your request for a trial to sales@kaseco.com.

By Dean Rogers

Spot Gold (XAU)

The long-term outlook for gold is still reasonably promising after prices rallied from a six-year low in December. However, from a technical standpoint, the decline from the 1263.48 swing high is poised to challenge support targets before the move up continues.

KaseX triggered a strong short entry signal called a pierced dart (gray down arrow and yellow triangle) on February 15. On that same day a bearish Harami line and star was completed. The subsequent pullback to 1240.02 held the 1263.48 swing high and was followed by a confirming short signal on Monday, February 22. Monday’s decline also completed another bearish Harami line and star. These factors call for the decline to continue for the near-term.

Gold Daily Candlestick ChartGold Chart

The primary wave that the move down formed, 1263.48 – 1191.02 – 1240.02, projects to 1194.5 as the 0.618 target. Most waves that meet the 0.618 projection extend to at least the 1.00 projection, which in this case is near the 1163.6 confluence point. 1163.6 is the decision point for a larger correction to 1126.2 and possibly lower. A close below 1163.6 would significantly dampen the likelihood of a continued rise, and a close below 1126.2 would shift the long-term outlook to negative.

Gold Table

First resistance is 1232.3. This is currently the 0.618 projection of the small wave up from 1191.02. A close over this would call for 1251.1, the 1.00 projection. As it stands, odds are 25 percent for a close over 1251.1 before at least 1194.5 is met. A close over 1251.1 would indicate that the move up should extend to at least 1277.1 and possibly 1331.0 and higher.

S&P 500 Index (SPX)

The S&P 500’s rally from a double bottom at 1810.1 has been relatively strong and is challenging the completion point of the formation at 1947.2. This is significant because a close over 1947.2 would complete the double bottom and open the way for a potential rally to the formation’s 2084.0 target.

S&P 500 Index Daily ChartSPX Chart

A similar double bottom had formed in late 2015 and was completed when the index closed over 2020.86. The ensuing move fell short of this double bottom’s 2177.0 target, but was still substantial. We could see a similar type of rally upon a close over 1947.2 that falls short of the 2084 target, but challenges key resistance before the decline continues.

Other technical factors, such as wave projections and retracements, call for at least 1971.6. This then connects to 2019.7, 2057.7, and finally 2084.

SPX Table

The move down stalled just below a key support level at 1849. This was the 1.00 projection of the wave 2134.72 – 1867.01 – 211.48. The index only closed for one day below this level, so this is still crucial support.

A normal correction of the move up should hold 1894.0 and must hold 1862. These are the 38 and 62 percent retracements from 1810.1 to 1946.7. Key support is 1848, and a close below this would shift the outlook back to negative and call for 1810 and lower again.

These are brief technical analyses with a 10-day outlook based upon Kase’s technical forecasting models and trading indicators KaseX and Kase StatWare. If you are interested in taking a trial of KaseX or Kase StatWare please contact sales@kaseco.com. We would love to get your thoughts about the forecasted targets and probabilities. Leave a comment or send them along with your request for a trial to sales@kaseco.com.

By Dean Rogers

March WTI pulled back from its $31.53 swing high made in early trading Tuesday after several nations, including Saudi Arabia and Russia, agreed to freeze production at current levels.

While this might be a step in the direction of a long-term recovery, halting output at current levels would do little for a market that is already oversupplied.

In addition, and most importantly, the deal is strapped with a major caveat: Iraq, Iran, and other large producers would also have to halt production increases. Reports indicate that Iran has balked at the idea of halting production levels as they aim to return their output to presanctions levels.

Regardless of the reasons for the move up, from a technical standpoint, the outlook for oil remains weak. WTI was due for a correction when the 1.382 projection of the wave $34.82 – 29.4 – 33.6 was met at $26.05. There were also plenty of positive technical factors leading into the correction. However, the move up stalled at $31.53 when several intraday momentum indicators, including KaseX, triggered overbought signals. In addition, $31.53 was near the 62 percent retracement of the decline from $34.82 to $26.05.

CLH6 20160216

Prompt month March futures have already retraced 50 percent of the move from $26.05 to $31.53. March is now poised to test support at $28.3. This is Friday’s midpoint and near the 62 percent retracement. A close below $28.3 would call for $27.3, Friday’s open, and then $26.7, the last target protecting the $26.05 low.

There is an outside chance that the move up could continue, and corrections of such a swift decline are bound to take place. Prices must overcome at least $30.5 to show the upward correction will possibly extend to $32.1 and higher.

This is a brief analysis and outlook for the next day or so. Our weekly Crude Oil Commentary is a much more detailed and thorough energy price forecast. If you are interested in learning more, please sign up for a complimentary four-week trial.

By Dean Rogers

Forecasts for freezing temperatures this weekend in the eastern U.S. have had a minimal impact on natural gas prices this week. Many traders are looking ahead to above normal temperatures in coming weeks. In addition, many speculate that Thursday’s EIA Natural Gas Storage Report will reflect the smallest withdrawal from storage for this time of year since 2012.

The negative sentiment is being reflected on the charts too. March natural gas is continuing to grind its way lower to targets below $2.00. Monday’s gap from $2.076 stalled at $2.172 and was quickly filled on Tuesday. Subsequently prices have fallen to $2.017 so far.

The move down will likely continue to be a grind. March has struggled to close below the psychologically important $2.00 level in recent weeks. That said, prices should fulfill targets below $2.00 as the waves down from $2.493 and $2.315 project to $1.95 and $1.90. We expect that these projections will be met before another significant correction takes place.

NGH6 20160210

Look for resistance at $2.10 and $2.18. The latter is key because it is the 62 percent retracement from $2.315 to $1.954 and is in line with the $2.172 swing high.

This is a brief natural gas forecast for the next day or so. Our weekly Natural Gas Commentary is a much more detailed and thorough analysis. If you are interested in learning more, please sign up for a complimentary four-week trial.