Natural Gas Short-Term Forecast – April 11, 2018

Natural gas is still oscillating within a range between nominally $2.60 and $2.80. Traders are likely waiting on external factors to push the market out of the range, so for now, erratic trading will most likely continue.

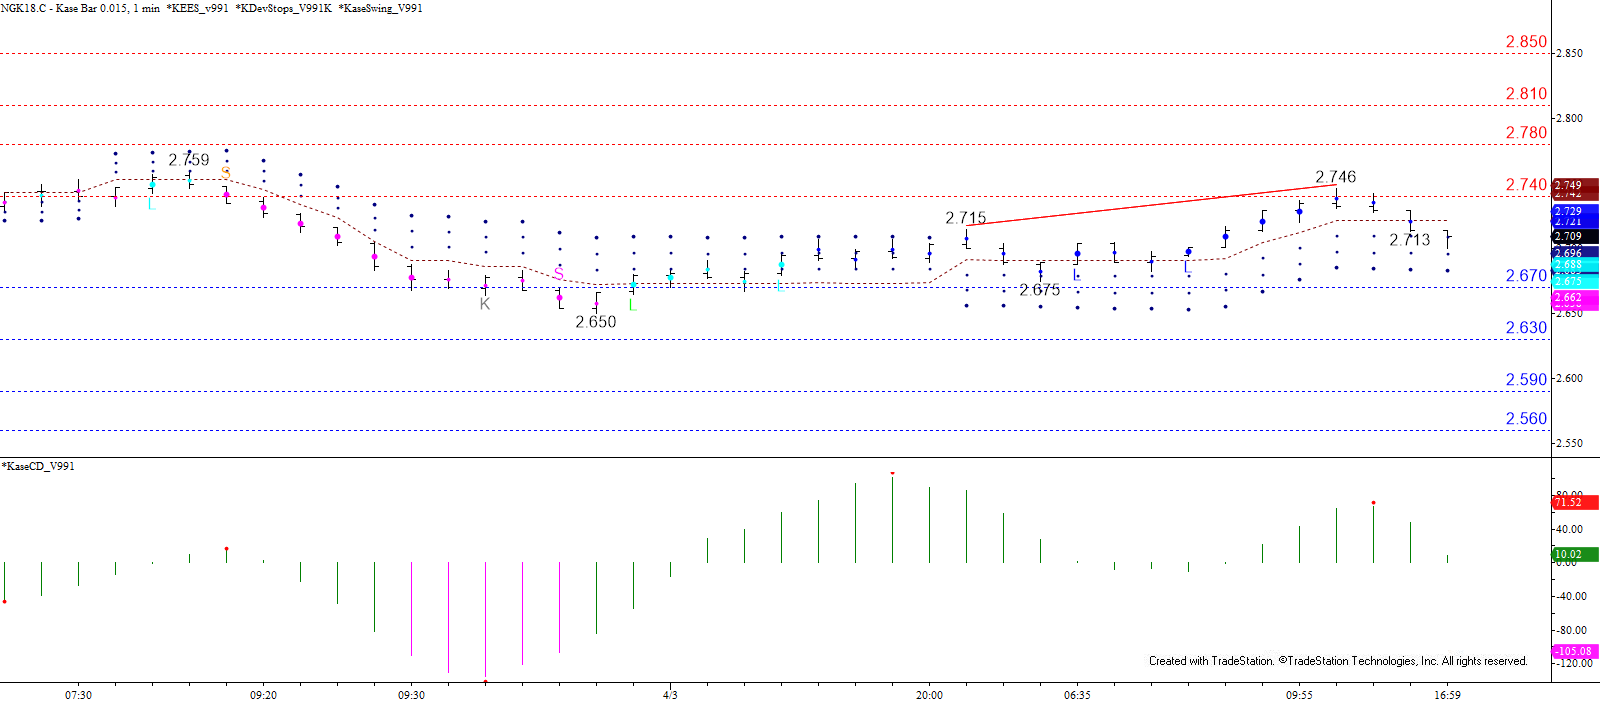
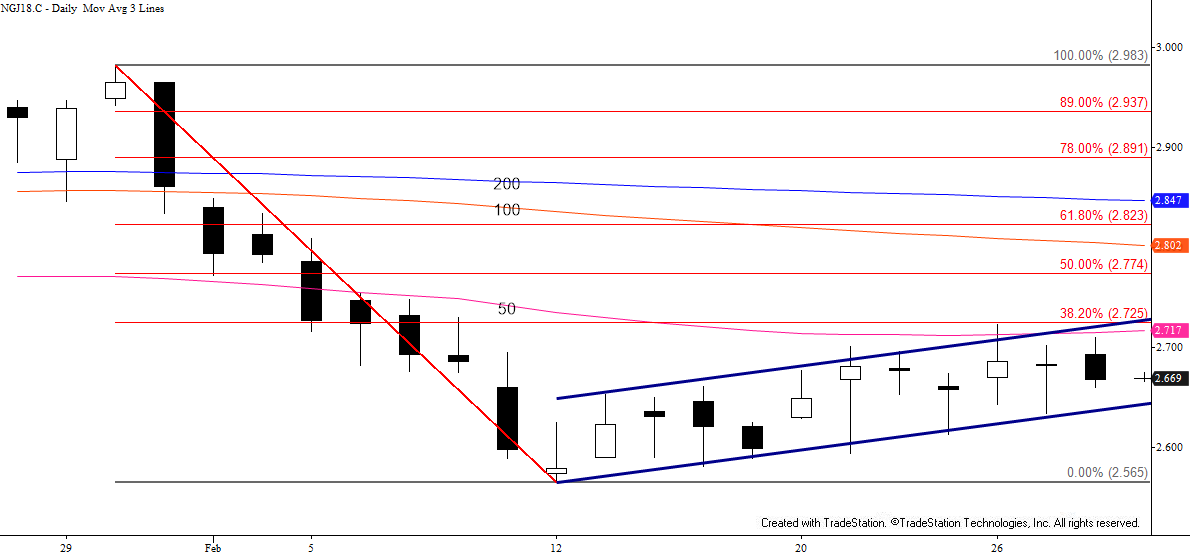
Prices briefly fell below the lower trend line of the bullish pennant (not a textbook example) that formed during the decline from $2.764. However, the move stalled at $2.621 before rising to $2.69 and forming an intra-day double-top. Due to this pattern and the settle below Tuesday’s midpoint and the 62 percent retracement of the decline from $2.726 near-term odds favor a test of $2.64 tomorrow. This is the intra-day double top’s target and the larger than target of the wave $2.69 – 2.667 – 2.69.

Natural Gas with Kase StatWare - 0.015 Kase Bar
Natural Gas with Kase StatWare – 0.015 Kase Bar

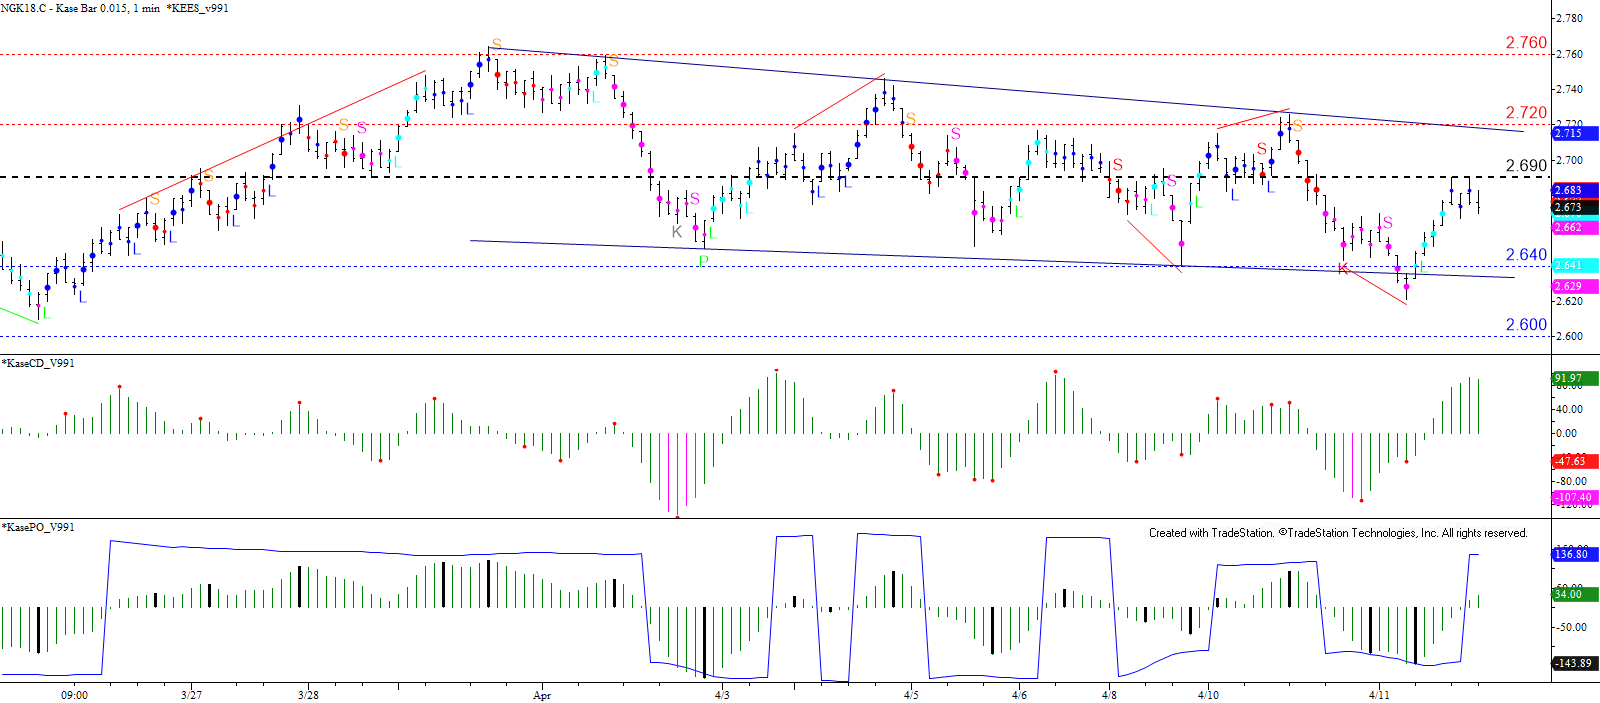
A close below $2.64 would call for $2.60 and lower, though given recent choppiness it would not be surprising to see $2.64 hold and for a test of $2.72 resistance to take place. This is near the upper trend line of the pennant. A close above this would call for $2.76 and possibly higher.

So, the market will most likely test a bit lower tomorrow before possibly challenging resistance again. But, with all factors considered, there is still no evidence that the market will break out of the trading range and determine a long-term direction.

This is a brief analysis for the next day or so. Our weekly Natural Gas Commentary and daily updates are much more detailed and thorough energy price forecasts that cover key natural gas futures contracts, calendar spreads, the UNG ETF, and several electricity contracts. If you are interested in learning more, please sign up for a complimentary four-week trial.

Natural gas continues to show signs that it has settled into a trading range between nominally $2.55 and $2.85. Trading will most likely remain erratic as the market awaits factors to push it out of the range. However, it may be awhile before such factors come forth as the market will be pressed to balance inventories that are well below the five-year average against strong production during the low demand spring shoulder months.

Quantitative factors are balanced and reflect the neutral near-term outlook. Today’s initial move lower held support at $2.67 before rising and challenging important resistance at $2.75. The subsequent pullback from $2.746 forms a long upper shadow on the daily candlestick and is poised to challenge $2.67 again tomorrow. The likelihood of a test of support was also accentuated by a confirmed bearish KaseCD divergence on the $0.015 Kase Bar chart. A close below $2.67 will call for $2.63, which connects to $2.59 and $2.56.

That said, trading will likely remain choppy and a close above $2.74 would open the way for $2.78. Settling above $2.78 would shift near-term odds in favor of challenging the top of the trading range around $2.85.

Natural Gas with Kase StatWare - 0.015 Kase Bar
Natural Gas with Kase StatWare – 0.015 Kase Bar

This is a brief analysis for the next day or so. Our weekly Natural Gas Commentary and daily updates are much more detailed and thorough energy price forecasts that cover key natural gas futures contracts, calendar spreads, the UNG ETF, and several electricity contracts. If you are interested in learning more, please sign up for a complimentary four-week trial.

The long-term outlook for natural gas is negative but the May contract met and held support around its $2.60 swing low Monday. The subsequent move up is most likely corrective of a longer-term decline to challenge $2.55 and lower. Even so, there is some technical evidence that the move up could still extend to at least $2.75 before another test of $2.60 and lower takes place.

The upward correction from the $2.61 swing low stalled at $2.731 today before pulling back to $2.69. The pullback forms an intra-day bullish pennant, so there is still a good chance the upward correction will extend. However, prices will have to break higher out of the pennant tomorrow and settle above $2.75 soon if the move up is going to challenge $2.82 and eventually key resistance at $2.86.

May Natural Gas - Daily
May Natural Gas – Daily

A move below $2.67 early tomorrow would be a likely sign that the pennant has failed and that the move down will challenge the $2.60 swing low again. A close below this would call for key lower support at $2.55, which is the last level protecting the continuation chart’s $2.522 swing low.

This is a brief analysis for the next day or so. Our weekly Natural Gas Commentary and daily updates are much more detailed and thorough energy price forecasts that cover key natural gas futures contracts, calendar spreads, the UNG ETF, and several electricity contracts. If you are interested in learning more, please sign up for a complimentary four-week trial.

Last week, April natural gas broke below the lower trend line of the upward sloping channel it had been oscillating within since February 12. Prices also settled below important support at $2.66. The move down hesitated yesterday, but resistance at $2.71 held this morning and prices fell below the $2.64 swing low today. All of this indicates that the outlook for natural gas remains negative and that major support in the mid-to-low $2.50s should be tested again soon.

Technical factors call for at least $2.62 and likely $2.59 tomorrow. There is trend line support around $2.62, and $2.59 is a confluent wave projection. Otherwise, there are no patterns or signals that indicate the move down will stall. A close below $2.59 would open the way for major support at $2.55. This is the last level protecting the continuation chart’s $2.522 swing low, a close below which would call for a much more bearish long-term outlook.

April Natural Gas - Daily
April Natural Gas – Daily

Should prices turn higher, the move up will most likely be corrective and should hold the $2.71 intra-day swing high. Key resistance for the near-term is $2.74. A sustained close above this would not doom the move down but would call for a larger upward correction before the decline continues.

This is a brief analysis for the next day or so. Our weekly Natural Gas Commentary and daily updates are much more detailed and thorough energy price forecasts that cover key natural gas futures contracts, calendar spreads, the UNG ETF, and several electricity contracts. If you are interested in learning more, please sign up for a complimentary four-week trial.

The near-term outlook for natural gas became more negative today and prices are poised to test at least $2.70 and possibly $2.66 tomorrow. The small move up at the end of the day indicates resistance will probably be challenged first, but $2.76 and no higher than $2.79 is expected to hold.

The confirmation of a daily evening star and bearish RSI divergence and the settle below the 50-day moving average have opened the way for a continued pullback from Tuesday’s $2.788 swing high. In addition, March 9’s $2.712 swing low was taken out when prices fell to $2.71. This was the first time since February 12, when the upward sloping channel began to form, that prices have fallen below a prior daily swing low. The move down may be corrective, but these bearish factors and reversal patterns have increased odds for a test of major near-term support at $2.66. A close below this would open the way for targets below $2.60 again.

That said, support at $2.72 held on a closing basis and the small move up from $2.71 will probably challenge today’s $2.76 midpoint first. This level should hold, but key resistance is $2.79, near today’s open. A close above $2.79 would shift near-term odds back in favor of $2.82 and ultimately $2.87, the key threshold to a more positive outlook as discussed in our longer-term weekly forecast.

This is a brief analysis for the next day or so. Our weekly Natural Gas Commentary and daily updates are much more detailed and thorough energy price forecasts that cover key natural gas futures contracts, calendar spreads, the UNG ETF, and several electricity contracts. If you are interested in learning more, please sign up for a complimentary four-week trial.

Since February 12, April natural gas had risen in a choppy upward sloping range that formed a bearish flag. However, prices broke higher out of the flag today and settled above the pattern’s upper trend line. The flag’s failure to break lower is bullish for the near-term and calls for a larger upward correction before the move down ultimately continues.

The next objective is $2.80, which is the 100-day moving average and a confluent projection for the multitude of waves and sub-waves that formed the flag. A close above this would call for $2.83 and possibly $2.87.

The $2.83 target is a potential stalling point because it is in line with the 62 percent retracement of the decline from $2.983 and the 200-day moving average. If the move up is going to remain a “normal” correction, $2.83 should hold.

April Natural Gas - Daily
April Natural Gas – Daily

Key resistance is $2.87. This is the smaller than (0.618) target for April natural gas’ wave $2.487 – 2.983 – 2.565. Waves that meet the smaller than target typically extend to the equal to (1.00) target, in this case, $3.06. Therefore, should April settle above $2.87 look for prices to rise above $3.00 again.

All of that said, the long-term outlook for natural gas remains negative, and even a move above $2.87 will do little to dampen that. For now, though, support at $2.70 should hold and key support is $2.65. These are the 38 and 62 percent retracements of the move up from $2.565, so far. A close below $2.65 would shift near-term odds back in favor of a continued decline to challenge major support in the low $2.50’s.

This is a brief analysis for the next day or so. Our weekly Natural Gas Commentary and daily updates are much more detailed and thorough energy price forecasts that cover key natural gas futures contracts, calendar spreads, the UNG ETF, and several electricity contracts. If you are interested in learning more, please sign up for a complimentary four-week trial.

The outlook for April natural gas remains negative. Prices are still oscillating within the upward sloping bearish flag, but today’s failure to test the top of the flag’s range at $2.73 indicates the formation should attempt to break lower tomorrow.

The flag’s lower trend line is nominally $2.64, but $2.63 is key because it is the 62 percent retracement of the move up from $2.565. It is also in line with the $2.633 swing low. A close below $2.63 will confirm the flag has broken lower and open the way for another test of $2.52, the gateway to a much more bearish long-term outlook.

April Natural Gas - Daily
April Natural Gas – Daily

Resistance at $2.73 should hold. This is near the top of the flag, the 50-day moving average, and the 38 percent retracement of the decline from $2.983. A close above this would call for a larger upward correction that could ultimately reach $2.84.

The $2.84 threshold is most important because it is split between the 62 percent retracement and the 200-day moving average. It is doubtful that prices will overcome (or even reach) $2.84 without significant help from external factors.

This is a brief analysis for the next day or so. Our weekly Natural Gas Commentary and daily updates are much more detailed and thorough energy price forecasts that cover key natural gas futures contracts, calendar spreads, the UNG ETF, and several electricity contracts. If you are interested in learning more, please sign up for a complimentary four-week trial.

March natural gas finally settled above February’s 9’s $2.64 midpoint. The move up is most likely corrective of the decline from $3.259 and will continue to be a grind. However, natural gas should now challenge at least $2.71 and possibly higher before the decline ultimately continues.

The wave $2.53 – 2.662 – 2.565 met its $2.65 smaller than (0.618) target today. Waves that meet the smaller than target typically extend to the equal to (1.00) target, in this case, $2.71. This is an important objective because $2.71 is also in line with February 9’s open and is the completion point of the weekly morning star setup.

March Natural Gas - 0.035 Kase Bar
March Natural Gas – 0.035 Kase Bar

Settling above $2.71 would call for a larger upward correction and test of key near-term resistance at $2.81. This is the 38 percent retracement of the decline from $3.259 and the 50-day moving average. For the move down to continue in the near-term $2.81 must hold. A sustained close above this would not doom the move down, but rather dampen the odds for a continued decline to targets below the continuation chart’s crucial $2.522 swing low over the next few weeks.

March Natural Gas - Daily
March Natural Gas – Daily

Initial support is $2.61 and key support for the next few days is the $2.565 swing low. A move below this would wipe out the aforementioned wave up from $2.53 that projects to $2.71 and higher. This would also shift near-term odds back in favor of testing $2.51 and lower.

This is a brief analysis for the next day or so. Our weekly Natural Gas Commentary and daily updates are much more detailed and thorough energy price forecasts that cover key natural gas futures contracts, calendar spreads, the UNG ETF, and several electricity contracts. If you are interested in learning more, please sign up for a complimentary four-week trial.

The outlook for March natural gas remains negative but the formation of another daily star (in this case a hammer) and the small wave formation up from $2.538 indicate there is still a good chance for the upward correction to extend first. However, as stated over the past few days in our premium analysis and daily updates, unless prices settle above at least $2.65 and likely $2.70, to complete and then confirm the morning star setup, odds will continue to favor a test of key support at $2.52.

Initial support is $2.56, the smaller than (0.618) target of the wave $2.642 – 2.553 – 2.619. A move below this early tomorrow will open the way for $2.52, the intermediate (1.382) target. This is a key objective because $2.52 is in line with the continuation chart’s $2.522 swing low and is also the 62 percent retracement of the move up from $1.611. A sustained close below $2.52 will call for a much more negative long-term outlook.

March Natural Gas - Daily
March Natural Gas – Daily

Should the corrective move up extend and settle above $2.70 to confirm the morning star, odds will shift in favor of a larger upward correction to at least $2.76 and likely $2.81 before the decline continues. For now, given all factors, $2.81 is expected to hold because it is the 38 percent retracement of the decline from $3.259 and near the 50-day moving average. Settling above $2.81 would call the market’s bearish sentiment into question and the likelihood of a near-term decline to targets below $2.52.

This is a brief analysis for the next day or so. Our weekly Natural Gas Commentary and daily updates are much more detailed and thorough energy price forecasts that cover key natural gas futures contracts, calendar spreads, the UNG ETF, and several electricity contracts. If you are interested in learning more, please sign up for a complimentary four-week trial.

Outlook for Natural Gas

March natural gas fell below the $2.693 swing low, which nullifies the wave $2.532 – 3.035 – 2.693 and any potential that the move up from $2.532 would extend as a five-wave pattern. Today’s decline also wiped out the yesterday’s bullish hammer and intra-day bullish divergences. Therefore, as of this afternoon, there is no technical evidence that the move down will stall before reaching at least $2.65.

The $2.65 objective is the smaller than (0.618) target of the waves $3.259 – 2.837 – 2.92 and $2.92 – 2.695 – 2.782. Settling below $2.65 will open the way for $2.60 and more likely $2.56, which then connects to $2.50. The connection between these targets is of utmost importance. A move to $2.50 would take out the continuation chart’s $2.522 swing low and confirm a long-term bearish outlook.

March 2108 Natural Gas - Daily
March 2108 Natural Gas – Daily

If there is anything positive that can be said, the wave structure down from $3.259 still lacks depth. So far, all of the upward corrections have been less than 21 percent retracements. There is no guarantee that an upward correction will take place, but daily momentum is reaching oversold territory.

For now, look for initial resistance at $2.76 and $2.82. The higher of these should hold as it is the 21 percent retracement of the decline from $3.259 and the 62 percent retracement from $2.92. Key resistance is $2.87, the 50-day moving average. A close above this would indicate the move down has stalled and could be an early indicator of consolidation before the decline ultimately continues.

This is a brief analysis for the next day or so. Our weekly Natural Gas Commentary and daily updates are much more detailed and thorough energy price forecasts that cover key natural gas futures contracts, calendar spreads, the UNG ETF, and several electricity contracts. If you are interested in learning more, please sign up for a complimentary four-week trial.