Natural Gas Price Forecast – January 27, 2021

Natural Gas Technical Analysis and Near-Term Outlook

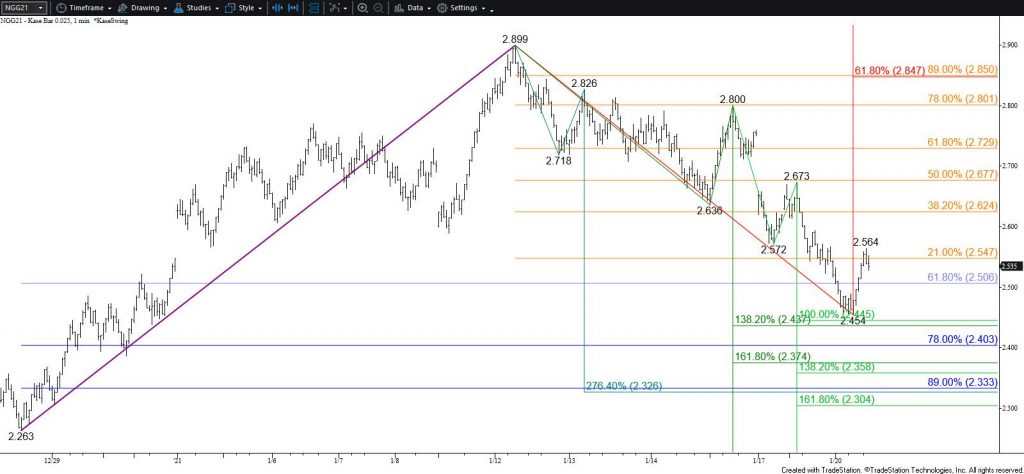
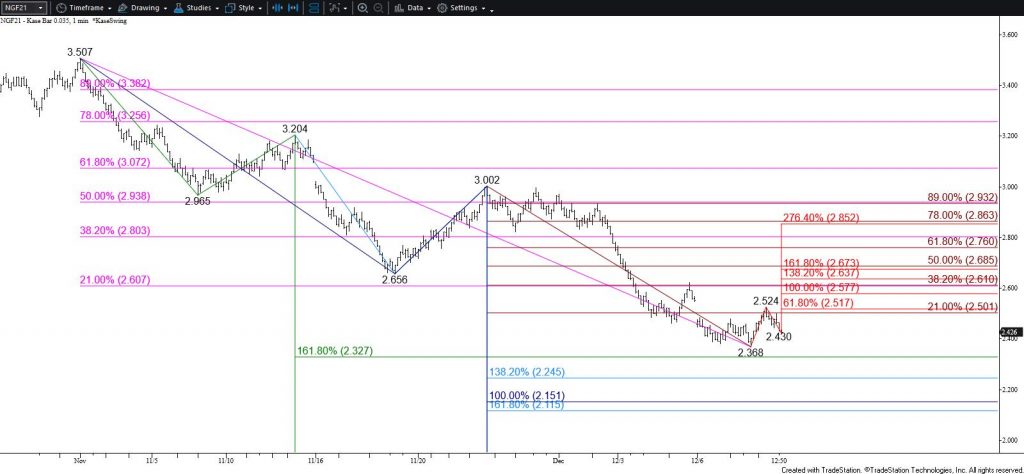
The near-term outlook for natural gas is bullish after meeting the smaller than (0.618) target of the primary wave up from $2.425 and settling above the 62 percent retracement of the decline from $2.835 and the 50-day moving average. Closing above $2.74 will call for a test of $2.78, the smaller than (0.618) target of the primary wave up from $2.268. This is also the barrier to a more bullish outlook during the next few weeks.

Natural Gas - $0.025 Kase Bar Chart
Natural Gas – $0.025 Kase Bar Chart

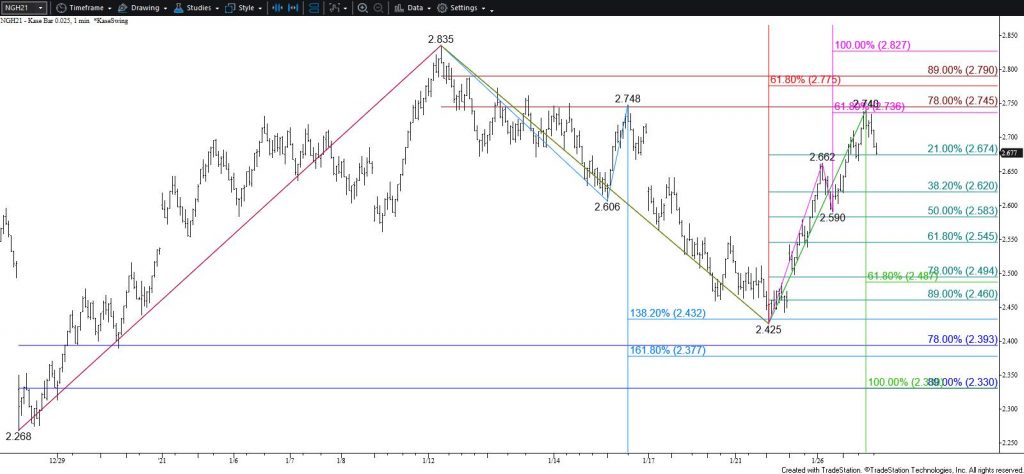
With that said, overcoming $2.78 will require another significant boost from bullish external factors (e.g., cold weather). Without such a spark there is still a reasonable chance that natural gas prices are settling into a trading range between nominally $2.78 and $2.49.

To that end, this afternoon’s pullback from today’s $2.74 high has already retraced 21 percent of the rise from $2.425. This pullback suggests that there is a reasonable chance for a deeper test of support before rising to challenge $2.74 again. For the move up to overcome $2.74 and make the push to $2.78 during the next few days, $2.62 must hold. Closing below this would signal that a trading range is forming and call for $2.55 and possibly $2.49. The $2.49 level is the gateway for a bearish outlook because this is the smaller than target of the newly formed primary wave down from $2.835.

This is a brief analysis for the next day or so. Our weekly Natural Gas Commentary and daily updates are much more detailed and thorough energy price forecasts that cover key natural gas futures contracts, calendar spreads, the UNG ETF, and several electricity contracts. If you are interested in learning more, please sign up for a complimentary four-week trial.

Natural Gas Technical Analysis and Near-Term Outlook

Natural gas fell as expected this morning and took out support around $2.51 before stalling at the $2.45 target. Taking out $2.51 was bearish for the outlook because this is the 62 percent retracement of the rise from $2.263. However, $2.51 held on a closing basis and a daily bullish hammer formed. This pattern suggests natural gas will rise to challenge resistance around $2.62 during the next couple of days and that prices might begin to consolidate into a trading range while waiting on more information from supply/demand factors (e.g., weather).

Natural Gas - $0.025 Kase Bar Chart
Natural Gas – $0.025 Kase Bar Chart

Natural gas might be hard-pressed to overcome $2.62 without a bullish shift in weather or other factors. However, closing above $2.62 will call for $2.67 and possibly $2.73. Settling above $2.73 would reflect a renewed bullish shift in sentiment and call for $2.85, the barrier to a firm bullish outlook.

With that said, a one day move up and unconfirmed hammer pattern is not enough to definitively call for the recent move down to end. Yesterday’s gap down and decline below the $2.589 swing low was a clear bearish shift in recent sentiment. Taking out $2.50 will call for another test of $2.45, a close below which will clear the way for a continued decline.

This is a brief analysis for the next day or so. Our weekly Natural Gas Commentary and daily updates are much more detailed and thorough energy price forecasts that cover key natural gas futures contracts, calendar spreads, the UNG ETF, and several electricity contracts. If you are interested in learning more, please sign up for a complimentary four-week trial.

Natural Gas Technical Analysis and Near-Term Outlook

The outlook for natural gas in the coming weeks is bullish after breaking higher out of a broadening wedge and meeting the $2.90 smaller than (0.618) target of the primary wave up from $2.263. This wave now favors an eventual rise above the crucial and psychologically important $3.00 level to reach its $3.10 equal to (1.00) target.

However, the 50-day moving average held on a closing basis again and the decline from $2.899 has formed two sequential daily shooting stars. The wave formation is also poised to test $2.66 before the move up continues. Therefore, the near-term outlook leans bearish.

Natural Gas - $0.025 Kase Bar Chart
Natural Gas – $0.025 Kase Bar Chart

The move down is most likely a corrective throwback to test the upper trend line of the broadening wedge, which is in line with $2.66. This is also the 38 percent retracement of the rise from $2.263. Therefore, $2.66 is expected to hold. Closing below this will dampen odds for a continued rise and call for $2.58 and then a test of key support and the barrier to a renewed bearish outlook at $2.52.

This is a brief analysis for the next day or so. Our weekly Natural Gas Commentary and daily updates are much more detailed and thorough energy price forecasts that cover key natural gas futures contracts, calendar spreads, the UNG ETF, and several electricity contracts. If you are interested in learning more, please sign up for a complimentary four-week trial.

Natural Gas Technical Analysis and Near-Term Outlook

The outlook for natural gas is bullish after challenging a crucial target around $2.74 today. Nevertheless, this objective and the $2.775 swing high held on a closing basis. Therefore, $2.74 is still a factor for the near-term. Closing above this and overcoming the $2.775 swing high will confirm a winter bottom has been made and clear the way for a push toward the next major objective and a long-term bullish decision point at $3.00.

Natural Gas - $0.035 Kase Bar Chart
Natural Gas – $0.035 Kase Bar Chart

Nevertheless, the wave formation up from $2.263 is due for a test of support before rising much higher. Moreover, today’s high wave candlestick (long upper and lower shadows) reflects uncertainty. Therefore, there is a reasonable chance for a test of $2.663 and possibly $2.58 before natural gas settles above $2.74 and overcomes the $2.775 swing high. Support at $2.58 is expected to hold. Closing below this will call for a deeper test of support where $2.46 is the barrier to a renewed bearish outlook.

This is a brief analysis for the next day or so. Our weekly Natural Gas Commentary and daily updates are much more detailed and thorough energy price forecasts that cover key natural gas futures contracts, calendar spreads, the UNG ETF, and several electricity contracts. If you are interested in learning more, please sign up for a complimentary four-week trial.

Natural Gas Technical Analysis and Near-Term Outlook

Natural gas formed another hanging man pattern today. As discussed yesterday, this would normally dampen odds for a larger test of resistance. However, the intra-day wave formation up from $2.368 looks to be unfolding as a five-wave pattern, and the move up from $2.596 is likely Wave V, which targets $2.80. This is the XC (2.764) projection of Wave I, the smaller than (0.618) target of Wave III, and the larger than (1.618) target of Wave 1/V. The connection to $2.80 is made through $2.72 and then $2.76.

Natural Gas - $0.035 Kase Bar Chart
Natural Gas – $0.035 Kase Bar Chart

Once $2.80 is met, a significant three-wave test of support is anticipated. An eventual close above $2.80 would call for the move up to unfold as a larger five-wave pattern (or at least a nested three-wave pattern) that targets $2.93 and higher.

With that said, the hanging man patterns warn that the move up might be a simple three-wave correction of the decline from $3.507 that is stalling around $2.70. Should natural gas take out the $2.618 swing low look for a test of $2.58. This is the 38 percent retracement of the rise from $2.368 and is a level that must hold for the move up to continue to unfold as a five-wave pattern as expected. Settling below $2.58 would call for a test of key support at $2.50, a close below which would confirm the corrective move up is over and would shift odds back in favor of a continued decline.

This is a brief analysis for the next day or so. Our weekly Natural Gas Commentary and daily updates are much more detailed and thorough energy price forecasts that cover key natural gas futures contracts, calendar spreads, the UNG ETF, and several electricity contracts. If you are interested in learning more, please sign up for a complimentary four-week trial.

Natural Gas Technical Analysis and Near-Term Outlook

The outlook for natural gas remains bearish due to the sustained close below $2.48. This was a highly confluent and crucial wave projection for the January contract and the continuation chart that connects to $2.15 as the next major objective. Near-term odds favor a continued decline and a close below $2.37 will clear the way for $2.33 and likely lower during the next couple of days.

Natural Gas - $0.035 Kase Bar Chart
Natural Gas – $0.035 Kase Bar Chart

With that said, Monday’s potential intra-day exhaustion gap, today’s inverted hammer, and confirmed weak bullish KasePO, KaseCD, and MACD divergences suggest a bottom might be forming. These signals do not exude a bullish shift in sentiment, but a move above $2.52, the smaller than (0.618) target of the wave up from $2.368, will call for a test of $2.58. Rising to $2.58 would overcome Monday’s gap down and confirm that this was most likely an exhaustion pattern. A close above $2.58 would call for a larger test of resistance with the next thresholds at $2.67 and $2.76.

This is a brief analysis for the next day or so. Our weekly Natural Gas Commentary and daily updates are much more detailed and thorough energy price forecasts that cover key natural gas futures contracts, calendar spreads, the UNG ETF, and several electricity contracts. If you are interested in learning more, please sign up for a complimentary four-week trial.

Natural Gas Technical Analysis and Near-Term Outlook

Natural gas took out the $2.823 swing low and confirmed the small double top that formed around $3.00. Natural gas also settled below the 62 percent retracement of the rise from $2.656. Odds favor a continued decline and the waves and subwaves down from $3.002 call for a test of at least $2.70 and likely $2.66 tomorrow. The double top’s target is in line $2.66. The $2.66 objective is key because this is also the equal to (1.00) target of the wave down from $3.507 and the smaller than (0.618) target of the subwave down from $3.204. Settling below $2.66 will clear the way for the next leg of the move down to $2.54 and eventually $2.47.

Natural Gas - $0.025 Kase Bar Chart
Natural Gas – $0.025 Kase Bar Chart

There are no bullish reversal patterns or signals that call for the move down to stall. Even so, should natural gas bounce before falling much lower look for initial resistance at $2.84. Rising above this will call for $2.90, which is expected to hold. Key resistance is $2.97, the smaller than target of the wave up from $2.656 and the 38 percent retracement of the decline from $3.507. Settling above $2.97 would clear the way for $3.09 and possibly higher.

This is a brief analysis for the next day or so. Our weekly Natural Gas Commentary and daily updates are much more detailed and thorough energy price forecasts that cover key natural gas futures contracts, calendar spreads, the UNG ETF, and several electricity contracts. If you are interested in learning more, please sign up for a complimentary four-week trial.

Natural Gas Technical Analysis and Near-Term Outlook

January natural gas fulfilled the $2.99 objective as called for at today’s $3.002 high. This objective held on a closing basis as expected and a test of support is underway. However, the decline from $3.002 will likely prove to be a short-lived correction of the move up from $2.656. This is because the newly formed primary wave up from $2.656 met its smaller than (0.618) target at $3.002. Therefore, this wave now favors a move to fulfill its $3.09 equal to (1.00) target, which is in line with the 50 percent retracement of the decline from $3.507. Settling above $3.09 will call for a test of key resistance and the decision point for a renewed bullish outlook around $3.19.

Natural Gas - $0.025 Kase Bar Chart
Natural Gas – $0.025 Kase Bar Chart

The decline from $3.002 has already retraced 21 percent of the move up from $2.656. There is a good chance for natural gas to fall to $2.87, the 38 percent retracement, before the move up continues. Support at $2.87 is expected to hold. Closing below this will call for key near-term support at $2.79. Settling below $2.79 would shift odds back in favor of challenging major support at $2.66 again.

This is a brief analysis for the next day or so. Our weekly Natural Gas Commentary and daily updates are much more detailed and thorough energy price forecasts that cover key natural gas futures contracts, calendar spreads, the UNG ETF, and several electricity contracts. If you are interested in learning more, please sign up for a complimentary four-week trial.

Natural Gas Technical Analysis and Near-Term Outlook

Natural gas settled below crucial support around $2.72 for the third straight day. Odds continue to favor a larger decline and a test of the next major objective at $2.51. Falling below $2.68 will call for $2.63, which then connects to $2.51.

Nevertheless, Tuesday’s long-legged doji and Wednesday’s inverted hammer suggest a larger test of resistance might take place before taking out $2.63. Today’s initial move up held Monday’s $2.78 midpoint, but a close above this will complete the long-legged doji and inverted hammer. This would then call for a test of $2.82 and possibly $2.87. The $2.87 level is key for the near-term because this is the confirmation point for the long-legged doji and inverted hammer and is in line with the bottom of Monday’s gap down from $2.949. Settling above $2.87 is doubtful but would reflect a bullish shift in external factors and sentiment.

Natural Gas - $0.025 Kase Bar Chart
Natural Gas – $0.025 Kase Bar Chart

This is a brief analysis for the next day or so. Our weekly Natural Gas Commentary and daily updates are much more detailed and thorough energy price forecasts that cover key natural gas futures contracts, calendar spreads, the UNG ETF, and several electricity contracts. If you are interested in learning more, please sign up for a complimentary four-week trial.

Natural Gas Technical Analysis and Near-Term Outlook

Natural gas rose to challenge important near-term resistance around $3.05 this afternoon. This is a confluent wave projection and the 38 percent retracement of the decline from $3.396. This is also a potential stalling point. However, today’s close above $3.03, the smaller than (0.618) target of the primary wave up from $2.821, calls for a test of $3.12 and possibly $3.18 during the next few days. The $3.12 objective is the equal to (1.00) target and 50 percent retracement. The $3.18 objective is the intermediate (1.382) target and 62 percent retracement. The latter objective is most important because settling above $3.18 would reflect a bullish shift in external factors (e.g. weather) and near-term sentiment.

Natural Gas - $0.025 Kase Bar Chart
Natural Gas – $0.025 Kase Bar Chart

Nevertheless, the move up is still corrective of the decline from $3.396 and also stalled near the 100-day moving average this afternoon. Additionally, because of the confluence and importance of resistance around $3.05, a test of $2.97 will probably take place first. Falling below this will call for key near-term support at $2.91. This is the 62 percent retracement of the rise from $2.821 and is in line with the $2.911 swing low. Taking out $2.91 will invalidate the wave up from $2.821 that calls for $3.12 and $3.18 and would shift odds back in favor of another test of $2.82 and likely lower.

This is a brief analysis for the next day or so. Our weekly Natural Gas Commentary and daily updates are much more detailed and thorough energy price forecasts that cover key natural gas futures contracts, calendar spreads, the UNG ETF, and several electricity contracts. If you are interested in learning more, please sign up for a complimentary four-week trial.