Natural Gas Still Testing (and Holding) $2.79

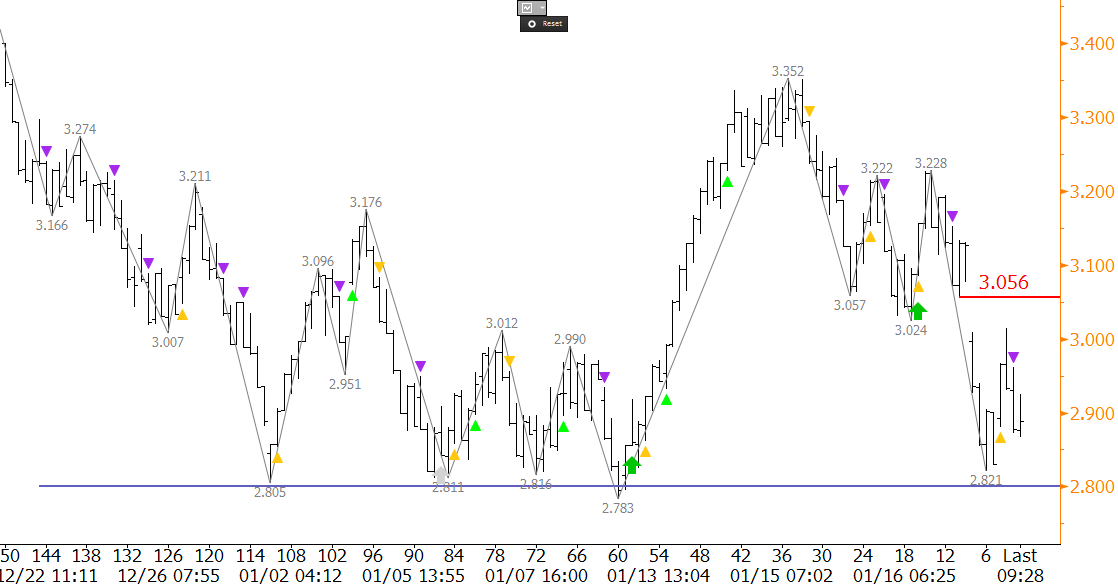
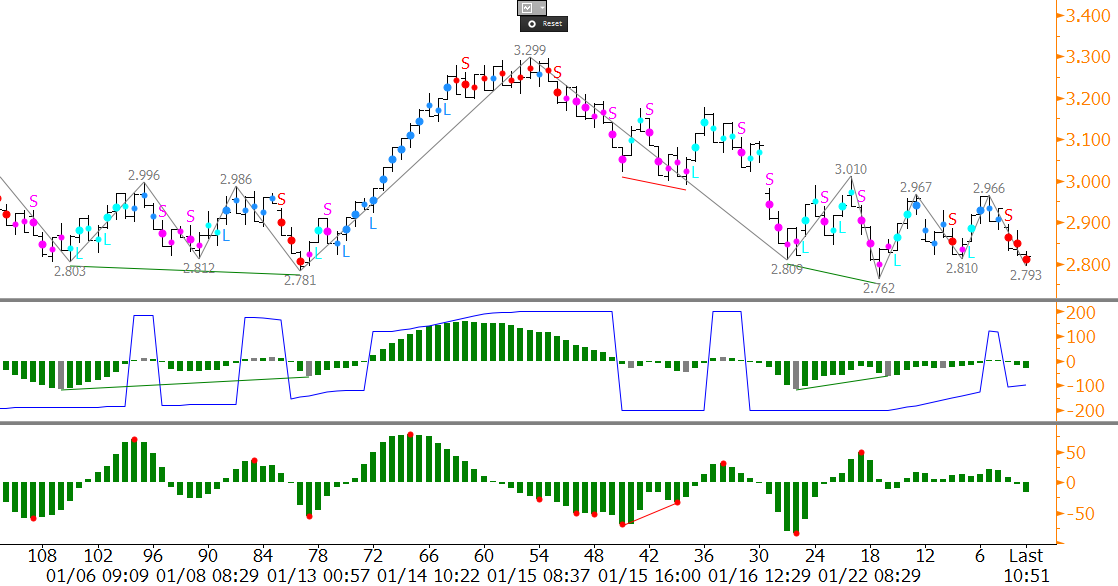
Natural gas has positioned itself for a break out of the recent coiling pattern that began forming on January 20. March futures tested the crucial $2.79 area this morning, and most technical factors still favor continued decline. However, March’s inability to close below $2.79 is making this recent range look more like a short-term bottoming formation versus a corrective pattern. In addition, a bullish KasePO divergence and first class long permissions (blue dots) for the KEES indicator on the 240-minute equivalent Kase Bar chart indicate prices may attempt to rise above $3.01 again after tomorrow’s U.S. Energy Information Administration (EIA) Natural Gas Weekly Update.

NGH15

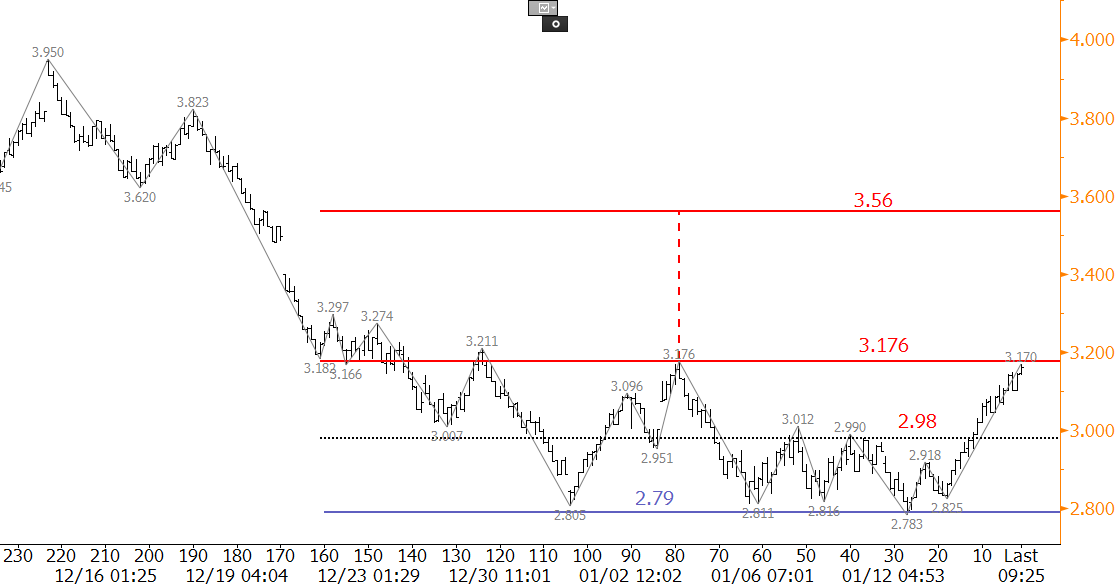
The key for a break higher will be a close over $2.97. This is the 0.618 projection for the wave $2.762 – 3.957 – 2.81. March already stalled at this level once, but overcoming $2.97 would open the way for $3.01, which then connects to $3.08 as the 1.382 projection. The $3.08 level is also near the top of the window that took place between January 16 and 20, so a close over this in coming days would be bullish for the near-term outlook.

That said, even though March has held $2.79 on a closing basis thus far, it has not been able to maintain momentum behind any recent price rise. If natural gas cannot break higher this week, the odds of an extended upward correction will quickly diminish. A close below $2.79 would then open the way for the next leg down, where the first target of that move is $2.71.


Last week’s natural gas price rise was poised to fill December 22nd’s gap from $3.48, but the upward correction stalled at $3.352. The week settled above the $3.09 midpoint of Wednesday, January 12th’s candlestick, leading to speculation that the market might try to rise again early this week. However, Monday’s intraday gap down from $3.056 and settle back below $3.00 was negative for the near-term outlook.

There is still major support at $2.80 that has held so far, but after this morning’s move up stalled and failed to fill to $3.056 gap it looks as though a bearish U.S. Energy Information Administration (EIA) Natural Gas Weekly Update is expected tomorrow.

The key wave for the short-term is $3.352 – 3.024 – 3.228. This wave has already fallen below its 1.00 projection at $2.90 and is poised to meet at least its 1.382 projection at $2.77. This then connects to $2.66 as the 1.618 projection. The $2.66 target is highly confluent for many of the larger and earlier waves down, and is the 0.618 projection for the wave $3.95 – 2.783 – 3.352. The confluence is important because a sustained close below $2.63 would open the way for a decline into the mid-to-low $2’s over the course of the longer-term. Therefore, $2.63 is a potential stalling point for the decline.

nat gas

The KaseX indicator on the 240-minute equivalent Kase Bar (KBAR) also confirms the negative outlook and has generated several short signals (purple arrows) during the decline from $3.352. The most recent short signal came after the $3.015 swing high this morning. At this point, there are no warning signals that indicate profit should be taken or that short trades should be exited. This will likely change though should prices recover above the $3.015 swing high.

First resistance ahead of the EIA report is $3.06, which is near the top of the $3.056 gap. A move above this would call for 3.15, which is the 0.618 projection for the wave $2.783 – 3.352 – 2.821. The $3.15 level is confirmed as the 62 percent retracement from $3.352 to $2.821. It is also interesting to note that this morning’s rise to $3.015 stalled just below the 38 percent retracement at $3.02. This is another negative factor.

To summarize, the bias is negative, and the move down is expected to continue. There is strong support at $2.80, but a move below this would call for at least $2.77 and very likely $2.66. Resistance at $3.06 will likely hold, but a move above that would open the way for at least $3.15.

For more information about KaseX please visit our Trading Indicators Page. To take a trial of Kase’s in-depth weekly energy forecasts on natural gas and crude oil please visit the Energy Forecasts Page.


Natural gas has finally showed some signs of life over the past few days in anticipation of tomorrow’s U.S. Energy Information Administration (EIA) Natural Gas Weekly Update. The short-term charts are showing that traders are anticipating a bullish EIA report, which would be the support the market needs to continue this upward correction. Keep in mind though, this is a correction, and it will likely be predominant in the winter month contracts and short-lived without continued support from external factors.

After oscillating in a sideways range between approximately $2.79 and $3.00 for the past six trading sessions, the February futures contract rose above $3.00 on Wednesday. This is near the $3.176 to $2.783 midpoint of $2.98, which is significant because this is also in line with the 0.618 projection of the irregular wave $2.803 – 3.176 – 2.783. The $1.00 projection of this wave was overcome at $3.15, and the 1.618 projections is $3.38. The $3.38 level is important because it is the 50 percent retracement from $3.95 to $2.783. This level will likely be met, and possibly overcome, upon a bullish EIA number tomorrow.

NGG

In addition, February overcame the crucial $3.176 swing high, and a sustained close over this would confirm the recent bottoming formation (arguably a triple or even quadruple bottom). The projection for this formation is $3.56.

Near-term support is $3.04 and then $2.94. These are the 38 percent and 62 percent retracements of the move up from $2.783 to $3.204 (swing high as of this analysis). These levels are also near the midpoint and open of today’s candlestick. A close back below $3.04 would call into question the validity of the move up. A close below $2.94 would negate the near-term positive tone altogether, and open the way for a continued decline.

The long-term outlook for natural gas is bearish, but the move up over the past two days has shifted the near-term outlook to positive. A close over the $3.176 swing high today will open the way for an extended correction to $3.38 and possibly higher tomorrow.

For more information about Kase’s weekly energy forecasts on natural gas and crude oil please visit our energy forecast page.

Dean Rogers
Senior Analyst
Kase and Company, Inc.

The outlook for natural gas is negative, and without help from external factors the decline will likely continue. However, the market is hesitant to break support at $2.80 in the near-term, and is likely waiting on tomorrow’s U.S. Energy Information Administration (EIA) Natural Gas Weekly Update before it presses higher or continues to decline.

Several positive technical factors indicate resistance will likely be tested before tomorrow’s EIA report. A small intraday double bottom formed at $2.805, as shown on the 120-minute equivalent Kase Bar chart. The confirmation point for the double bottom is $3.176, which is in line with the 1.00 projection for the wave $2.805 – 3.176 – 2.811. Immediate resistance is $3.04, the 0.618 projection. A move above $3.04 would call for $3.176 to be challenged, and a close over $3.176 would confirm the double bottom. This would then open the way for an extended correction to targets between $3.18 and the double bottom’s $3.54 target (calculation is 3.176 + (3.176 – 2.805) = 3.537). A move of this magnitude will not likely take place without major support from bullish external factors.

NGG

Should $3.176 hold, the move down will likely extend. First support is $2.89, and a close below this would call for a key target at $2.79. This is the 0.618 projection for the wave $3.176 – 2.811 – 3.012. A close below $2.79 would negate the double bottom and open the way for targets in the mid $2s.

Overall, the outlook is negative, and the move down is still favored. However, the double bottom, a daily morning star setup, and deeply oversold conditions, all indicate that a correction may take place very soon, and could be spurred by tomorrow’s EIA report.

Visit the Kase Energy Forecasts Page to sign up for a free trial of Kase’s weekly energy forecasts on natural gas and crude oil.


Kase’s senior analyst Dean Rogers reviews trade setups and price forecasts for e-mini S&P 500, crude oil, natural gas, AAPL, and VIPS using Kase Outlook, Kase StatWare, and KaseX.

http://youtu.be/pLCujMm5-WE


This is the fourth of a four part series on Kase Wave Analysis. In this video Kase’s senior analyst, Dean Rogers, shows how the Kase Wave Analysis can be combined with other technical factors and indicators to make trading decisions.

http://youtu.be/3JcHjdr2QWM


The Kase Commentaries on Crude Oil and on Natural Gas provide highly accurate weekly near term market outlooks. Kase’s analysis has proven to be remarkably accurate in identifying critical market turning points and probable market behavior.nnThe Commentary is highly technical, but interactive, so readers can click on unique words and phrases for definition to help them better understand the analysis. This is a great stand-alone product, but also works well as a companion product for Kase StatWare, KaseX or any of Kase’s Hedging Models.nnKase offers a free trial period for the Commentary so contact us today!

http://youtu.be/f8QZuOqZF5g


Successful long term hedging requires logical decision-making. Hedgers need to understand the underlying structure of the market and longer-term behavior in order to find points that minimize the risk and maximize the results of a hedge plan. It is also important to find the best balance for your company between budget oriented goals and achieving better than market prices. The HedgeModel identifies these low risk points and can be custom tailored to whatever strategy is befitting your mixture of goals and risk tolerance.

The HedgeModel is statistically based and does not require any previous trading experience to use. It is more-or-less mechanical and requires only 15 to 20 minutes per day to operate. It is data driven, so it works on any historic data stream in energy, including natural gas, crude oil, refined products, petrochemicals and crack spreads.

The Natural Gas Hedge Report is a companion product to Kase’s HedgeModel that includes a forecast for the perpetual, three-, six- and twelve-month strips. It also includes recommendations on how to set hedging strategies for the forthcoming quarter, changes to the settings used by HedgeModel, low-risk hedge targets, recommendations on what instruments to use, a track record and mark to market of recommended strategies, and research results.

Kase also performs ongoing research into market behavior and structure. Our research is oriented toward improving the results of our clients’ hedging strategies. In addition to a thorough evaluation of basis and correlation analysis, standard research in our quarterly Hedge Reports includes Monte Carlo simulations for estimating price distributions and objectives, statistical analysis of price and volatility, and cyclical behavior.

http://youtu.be/P3aigMq7h0A