Natural Gas Forecast: November Rises Back Above $3.00

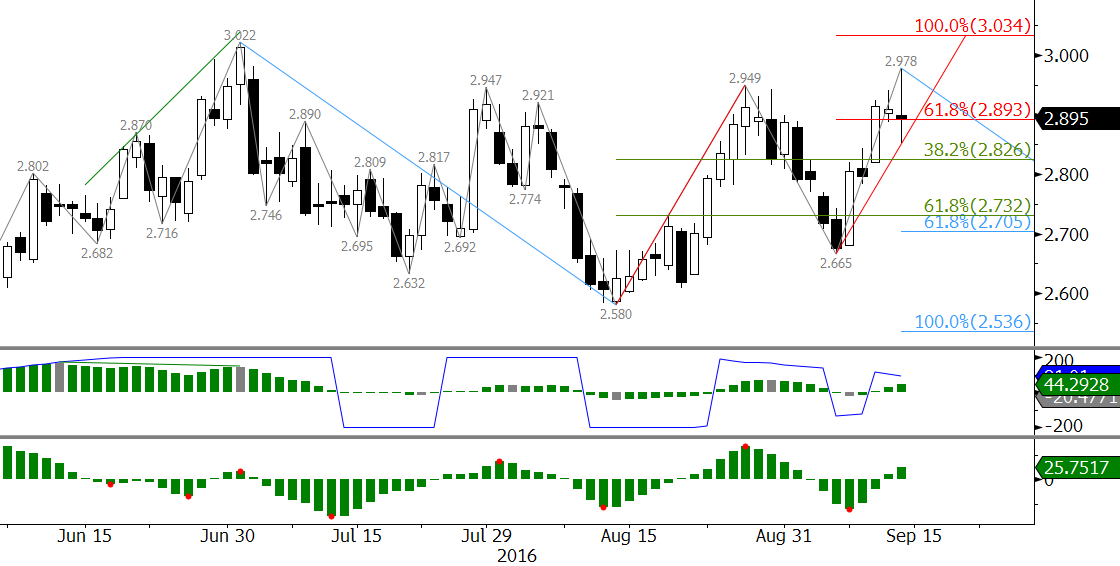
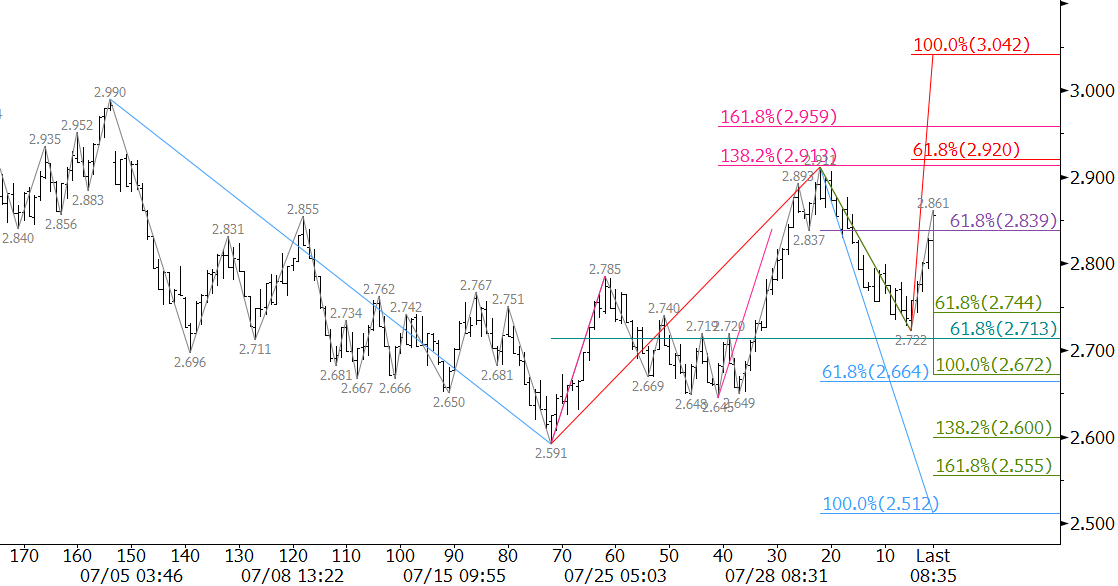
November natural gas has shown signs of strength over the past few days. November held support near $2.90 and on Tuesday completed a daily hammer when prices settled above $2.94. A bullish RSI divergence was confirmed at $2.866 on several intra-day charts. On Wednesday, the move up rallied to a very important $3.05 target ahead of the close. Finally, as of Wednesday, the weekly candlestick forms a bullish engulfing line.

These positive factors indicate the move up should continue to $3.09, $3.12, and possibly $3.18 over the next few days. A move to these targets would also take out the crucial $3.079 swing high. This would significantly dampen the odds for a continued decline to targets below $2.90.

ngx6-20161005

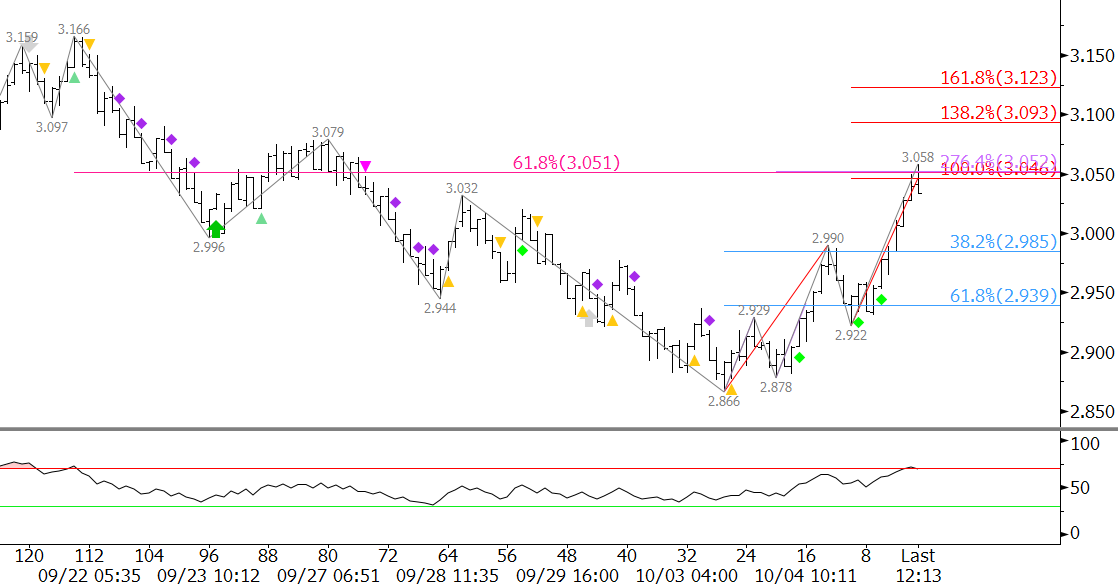
That said, $3.05 is a potential stalling point. This is because $3.05 is the 62 percent retracement of the decline from $3.166 to $2.866 and the 1.00 projection of the wave $2.866 – 2.99 – 2.922. There are no definitive factors that indicate the move will stall at $3.05, but caution is warranted.

Should prices pullback from $3.05, support at $2.98 should hold. The key level for the near-term is $2.94. This is the 62 percent retracement of the move up from $2.866 to $3.058. A close below $2.94 would call for another test of the $2.866 swing low and most likely signal that a trading range is forming.

This is a brief natural gas forecast for the next day or so. Our weekly Natural Gas Commentary and intra-week updates provide a much more detailed and thorough analysis. If you are interested in learning more, please sign up for a complimentary four-week trial.

Natural gas continues to oscillate in an erratic and corrective range. After stalling near $3.00 on July 1, the prompt-month futures contracts have challenged the boundaries of a range between nominally $2.53 and $2.95. This is similar to the range that natural gas traded in for nearly nine months of 2015 before breaking lower in mid-September.

Longer-term, the outlook is positive and natural gas will likely rise to targets above $3.00 before the end of the year. However, since July 1 there has not been enough fundamental support to sustain a move above $3.00. The summer was hot this year, and demand was strong, but production kept pace. The market is well supplied and will likely end the injection season near or just above historically high storage levels as winter approaches.

Many long-term technical factors are positive, but there are short-term factors that indicate another test of support is looming.

Early Wednesday, October natural gas rose above the very important $2.949 swing high and was poised to overcome the July 1 high of $3.022. However, October stalled at $2.978 and fell to $2.852. The reversal and blow-off high indicate the market is not ready for a break higher out of the corrective trading range.

ngv6-20160914

The recovery from $2.852 at the end of the day was somewhat positive. However, momentum is setup for bearish divergence on the daily chart. A bearish divergence forms when prices are rising to new swing highs but momentum is making lower highs. This signal shows that the move is nearing exhaustion and that a statically significant turn may take place. To confirm the divergence, a swing high in price and momentum must form over the next few days.

A close below $2.87 will complete Tuesday’s shooting star reversal pattern and open the way for $2.83 and $2.72.

If the move up is going to close over $2.95 and rise to the next target at $3.03 soon, $2.83 should hold. This is the 38 percent retracement of the move up from $2.58.

Key support is $2.72 because it is the 0.618 projection of the wave down from $3.022 and the 62 percent retracement of the move up from $2.58. A close below $2.72 would call for another test of the recent ranges lower threshold.

This is a brief natural gas forecast for the next day or so. Our weekly Natural Gas Commentary and intra-week updates provide a much more detailed and thorough analysis. If you are interested in learning more, please sign up for a complimentary four-week trial.

According to some pundits, natural gas’s recent move up is due to improved balancing of supply and demand. Government data shows the degree to which inventories are up this year relative to the five-year average has continued to shrink. It has been a hot summer, and demand has remained relatively strong.

That said, production has done well to keep pace with demand during summer, and there is a limit to the amount of gas that can be stored. Many analysts project that injection season will end at or near record levels again this year. Therefore, the market should be well supplied ahead of winter.

Fundamental factors will rule the longer-term. However, there are still many questions that need to be answered over the next six to eight weeks before the market can realistically determine a longer-term direction. For the near-term, a trading range between nominally $2.55 and $2.95 is still the most logical conclusion for now. Keep in mind, for nearly nine months of 2015 the prompt month futures contract traded in this range.

From a technical standpoint, October natural gas was poised to rise to $3.04 after overcoming resistance at $2.86 the $2.947 swing high late last week. The pullback from $2.949 is likely corrective and stalled near $2.81 on Wednesday. This is the 38 percent retracement of the move up from $2.58 and the 1.618 projection of the wave down from $2.949.

NGV6 20160831

If the move up is going to extend to new highs in the near term, $2.81 needs to hold. In addition, October will need to finally close over $2.95. Otherwise, a close below $2.81 would signal trading range and call for confluent support at $2.71 to be challenged.

This is a brief natural gas forecast for the next day or so. Our weekly Natural Gas Commentary and intraweek updates provide a much more detailed and thorough analysis. If you are interested in learning more, please sign up for a complimentary four-week trial.

Media sources indicate natural gas prices rose for the third straight session on Wednesday due to concerns that a storm could enter the Gulf of Mexico. However, hurricane threats to production are not as alarming as they had been in the past. The Gulf of Mexico accounts for less than five percent of domestic natural gas production. Most production has moved onshore due to the shale boom in recent years. In fact, many analysts, including ourselves, believe that a hurricane in the Gulf of Mexico would rather lead to decreased demand due to power outages and other disruptions.

Whatever the reasons (and there are likely many) for the increase in natural gas prices over the past few days, it is doubtful that a storm or hurricane entering the Gulf of Mexico will do much in the way of bolstering a price spike.

From a technical perspective, September natural gas rose to key resistance at $2.81 early Wednesday. This is the 62 percent retracement of the decline from $2.99 to $2.523 and the 1.382 projection of the wave $2.523 – 2.697 – 2.569. The 1.618 projection is $2.85, which is also near the trend line connecting $2.99 and $2.911. A close over $2.85 would call for $2.911 to be overcome and for prices to possibly challenge $2.99 and higher.

NGU6 20160824

That said, the range between $2.81 and $2.85 is a prime area for the move up to stall. Wednesday settled at $2.796 and prices have already started to pullback in late trading Wednesday afternoon. Look for initial support at $2.76 and $2.71. The latter should hold if the move up is going to continue because it is the 38 percent retracement from $2.523 to $2.819. The 62 percent retracement of this move defines key support for the near term at $2.64.

The most likely scenario right now is for prices to settle back into a trading range between nominally $2.64 and $2.85. This range dominated trading for most of July and could become dominant again in coming weeks as we move into the heart of shoulder month trading ahead of winter.

This is a brief natural gas forecast for the next day or so. Our weekly Natural Gas Commentary and intraweek updates provide a much more detailed and thorough analysis. If you are interested in learning more, please sign up for a complimentary four-week trial.

Late last week, September natural gas fulfilled important support near $2.51 when prices fell to $2.523. This is the 1.00 projection of the wave down from $2.99, the 50 percent retracement of the move up from $2.009, and the 62 percent retracement from $2.195. The confluence of targets around $2.51 indicate it is a potential turning point for natural gas.

Prices have risen from $2.523 to $2.648 so far, but the move has been extremely choppy and shallow. As a result, the move is most likely corrective. This is accentuated by the formation of a bearish pennant on the intra-day charts. Pennants are continuation patterns that indicate the prior trend should continue. In this case, the pennant favors a break lower. A close below $2.57 would confirm the break lower out of the pennant and open the way for another test of key support at $2.51.

NGU6 20160817

September natural gas has worked its way to important resistance at $2.64, but has not been able to close over this level yet. $2.64 is the 0.618 projection of the primary wave up from $2.523. A close over $2.64 would call for key resistance at $2.68. The $2.68 level is near the 38 percent retracement of the move down from $2.911 and is the midpoint of last Tuesday’s candlestick. A close over $2.68 would be a strong indication that prices will settle back into a trading range.

It is a tight call right now, but until there is a close over $2.68, odds favor a continued decline.

This is a brief natural gas forecast for the next day or so. Our weekly Natural Gas Commentary and intraweek updates provide a much more detailed and thorough analysis. If you are interested in learning more, please sign up for a complimentary four-week trial.

September natural gas’s correction down from $2.99 is extending after breaking lower out of a coil formation. Tuesday’s close below $2.66, the 0.618 projection of the wave $2.99 – 2.591 – 2.911, opened the way for the 1.00 projection at $2.51. The $2.51 target is also the 50 percent retracement of the move up from $2.009 to $2.99 and the 62 percent retracement from $2.195. Unless there is a bearish shift in underlying fundamentals, $2.51 should hold.

NGU6 20160803

The KaseCD, a second derivative momentum indicator, is setup for bullish divergence on the daily chart. First resistance is $2.63. The key level for the near-term is $2.68. This is Tuesday’s midpoint and the 38 percent retracement of the decline from $2.911. A close over $2.68 would indicate September natural gas will most likely settle back into the recent trading range.

This is a brief natural gas forecast for the next day or so. Our weekly Natural Gas Commentary and intraweek updates provide a much more detailed and thorough analysis. If you are interested in learning more, please sign up for a complimentary four-week trial.

September natural gas is trying to break higher out of the month long trading range. Two important boundaries have been established within the range. First between $2.71 and $2.84. Second between $2.66 and $2.96. Prices rose above $2.84 in early trading Wednesday, but closed just below at $2.839. Nonetheless, prices will likely push for at least $2.91 and possibly $2.96 tomorrow. A close over $2.96 would call for the bullish trend to extend to targets above $3.00. Given the strength of the moves up today and last Thursday, it looks as though prices will rise to new recovery highs soon.

NGU6 20160803

That said, a break higher out of the range in the near-term will likely hinge on tomorrow’s EIA Natural Gas Storage Report. A larger than expected build (some are looking for a draw in tomorrow’s report) could open the way for another test of $2.71. A close below this would then call for key support at $2.66.

With all technical factors considered, odds favor the move up tomorrow. September will need to close over $2.91 to keep the momentum it gained today and then close over $2.96 soon to open the way for targets above $3.00.

This is a brief natural gas forecast for the next day or so. Our weekly Natural Gas Commentary and intraweek updates provide a much more detailed and thorough analysis. If you are interested in learning more, please sign up for a complimentary four-week trial.

August natural gas stalled at $2.998 late last week. So far, August has pulled back to $2.697. The $2.998 swing high was in line with the 1.618 projection of the wave $1.99 – 2.494 – 2.157. From a technical standpoint, the move up was due for a correction. Momentum was exhausted and the bearish KasePO divergence indicates the correction that began Tuesday should now challenge major support levels.

NGQ6 20160706

Longer-term, the outlook for natural gas is positive. The move up looks to be forming five-waves. Wave III of the five-wave pattern was completed at $2.998. The corrective Wave IV is now underway. A normal correction should hold $2.61, the 38 percent retracement from $1.99 to $2.998. The $2.61 level was also strong support between June 10 and 17.

A close below $2.61 would open the way for a more significant correction. However, the longer-term bullish outlook would not be called into question unless there is a sustained close below $2.38. This is the 62 percent retracement of the move up from $1.99. Such a move is highly doubtful without a significant bearish shift in underlying fundamentals.

Wednesday’s hammer formation indicates the move down may halt to a grind lower. A test of Tuesday’s $2.84 midpoint will likely take place on Thursday. Key resistance is $2.88. This is the 62 percent retracement from $2.998 to $2.697. While $2.88 holds, odds will continue to favor a deeper correction.

This is a brief natural gas forecast for the next day or so. Our weekly Natural Gas Commentary and intraweek updates provide a much more detailed and thorough analysis. If you are interested in learning more, please sign up for a complimentary four-week trial.

August natural gas pushed to new highs Tuesday and early Wednesday before stalling at $2.974. Cooler than previously expected near-term temperature forecasts are reportedly the culprit for Wednesday’s pullback and settle at $2.863.

Longer-term, the outlook for natural gas is positive and is most likely forming a five-wave trend. The move up is due for a significant correction to form a potential Wave IV. Momentum is setup for bearish divergence. The Stochastic has also crept its way below the overbought threshold.

Charts show that August natural gas met a cluster of important wave projections at $2.974 Wednesday morning. The most significant was the 1.618 projection of the primary wave $1.99 – 2.494 – 2.157. It is rare for a primary wave such as this to extend beyond the 1.618 projection without a significant correction first.

NGQ6 20160629

The pullback from $2.974 forms a daily shooting star. This reversal pattern would be completed upon a close below Tuesday’s $2.82 midpoint and confirmed upon a close below the $2.751 open. This would then open the way for $2.66, the 38 percent retracement from $2.157 to $2.974.

This is a brief natural gas forecast for the next day or so. Our weekly Natural Gas Commentary is a much more detailed and thorough analysis. If you are interested in learning more, please sign up for a complimentary four-week trial.

July natural gas rose to a new high for 2016 when it overcame the January 8 swing high of $2.635. The move up extended to crucial resistance near $2.75 and stalled. $2.75 is a confluent target. Most importantly, it is the 1.382 projection of the primary wave $1.949 – 2.427 – 2.08.

Negative Factors

July’s decline on Wednesday is reportedly due to revised weather forecasts that call for cooler than previously expected temperatures over the next two weeks. In addition, some traders are allegedly concerned that factors behind the rapid price increase in recent weeks have been overhyped.

Momentum is setup for a bearish divergence on the KasePO and the Stochastic is in extreme overbought territory. There is also an evening star, which is a bearish candlestick reversal pattern. These factors indicate the correction that began late Wednesday afternoon should extend over the next few days.

NGQ6 20160622

Look for $2.64 to be tested tomorrow (or even Wednesday afternoon). This is currently the 21 percent retracement from $2.101 to $2.786. This was strong resistance and will likely be resilient support. A close below $2.64 would open the way for $2.52, the 38 percent retracement from $2.101. A normal correction should hold $2.52. However, after such a strong move up, the correction might be larger than normal.

Positive Factors

The longer-term outlook for natural gas is positive. This downward correction will most likely form a complex Wave IV of a longer-term five-wave trend. However, should prices turn higher again tomorrow, look for resistance at $2.72 followed by $2.80 and most importantly $2.87. The latter is the 1.618 projection of the wave up from $1.949. A significant correction will almost certainly take place before $2.87 is overcome should the current correction stall before reaching at least $2.52.

This is a brief natural gas forecast for the next day or so. Our weekly Natural Gas Commentary is a much more detailed and thorough analysis. If you are interested in learning more, please sign up for a complimentary four-week trial.