Natural Gas Forecast: Corrective Pullback

October natural gas’ settle below Monday’s $3.098 midpoint opens the way for a larger correction to at least $3.06. The move down is most likely corrective. However, for the move up to continue over the next few days $3.06 needs to hold. A close below this would not doom the move up but rather indicate that a deeper test of support and possible consolidation will begin to take place.

Natural Gas Wave Projections

Initial resistance is $3.13, the 62 percent retracement of the decline from $3.166, so far. $3.17 is the key threshold for the near-term. A close above this would indicate the corrective pullback is over and that the move up will extend to $3.23. This is currently the most confluent objective making it another potential stalling point.

This is a brief analysis for the next day or so. Our weekly Natural Gas Commentary and daily updates are much more detailed and thorough energy price forecasts that cover key natural gas futures contracts, calendar spreads, the UNG ETF, and several electricity contracts. If you are interested in learning more, please sign up for a complimentary four-week trial.

October natural gas settled above $3.03 and fulfilled the $3.06 target. The next objective is $3.09, the equal to (1.00) target of the wave $2.88 – 3.088 – 2.885. The key objective is $3.12, the smaller than (0.618) target of the wave $2.799 – 3.042 – 2.88. This has been strong resistance all summer for October and the continuation chart, making it a decision point for a larger scale move up and sustained recovery.

Natural Gas Daily Chart

A sustained close above $3.12 would open the way for $3.17 and $3.22. Above $3.12 the $3.22 objective is most important because it is the 50 percent retracement of the decline from $3.619. This is also a confluent projection for the aforementioned waves up from $2.799 and $2.88.

Daily momentum does not show any signs that the move up will stall. However, a few intraday charts are setup for divergence or are overbought. Therefore, given $3.12 has been such strong resistance a pullback might take place before it is overcome.

At this point, any move down will most likely be corrective. Tomorrow, support at $3.03 should hold. Key support is $2.96, which is the 50-day moving average and 62 percent retracement of the move up from $2.88 so far.

This is a brief analysis for the next day or so. Our weekly Natural Gas Commentary and daily updates are much more detailed and thorough energy price forecasts that cover key natural gas futures contracts, calendar spreads, the UNG ETF, and several electricity contracts. If you are interested in learning more, please sign up for a complimentary four-week trial.

Yesterday’s decline was a dose of reality that has set natural gas back into a state of uncertainty. With all factors considered, October natural gas will most likely settle back into a neutral trading range between nominally $2.91 and $3.04. This is about the same range prices oscillated within before last Thursday’s break high out of the bullish flag.

Natural Gas Kase Bar Chart

The wave formation down from $3.088 and a bearish daily KaseCD divergence call for $2.95, which then connects to $2.91. A close below $2.91 would call for $2.85, which in turn, would take out the crucial $2.88 swing low. A move below $2.88 would wipe out the wave up from $2.799 that projects to key upper resistance at $3.12.

That said, the 50-day moving average has held, so there is a modest chance the wave up from today’s $2.96 low could extend to $3.04 first. At this point we expect $3.04 to hold. However, a close above this would call for another attempt at $3.09 and possibly $3.12.

This is a brief analysis for the next day or so. Our weekly Natural Gas Commentary and daily updates are much more detailed and thorough energy price forecasts that cover key natural gas futures contracts, calendar spreads, the UNG ETF, and several electricity contracts. If you are interested in learning more, please sign up for a complimentary four-week trial.

October natural gas looks to be well balanced as it continues to oscillate in a range between nominally $2.88 and $3.03. The range forms a bullish flag after holding support at $2.88 on Monday. However, today’s early move up stalled before it could overcome the $2.998 swing high and challenge the flag’s $3.03 upper trend line.

Flags are generally reliable continuation patterns. However, in this case, we believe there is a high probability that $3.03 will hold and that ultimately prices will break lower out of the pattern. This is because the pattern has been very wide relative to the prior move up from $2.799 to $3.042. In addition, prices have not been able to overcome the psychologically important $3.00 level for the past few days.

NGV17 Kase Bar Chart
NGV17 $0.035 Kase Bar Chart

Because the wave $2.88 – 2.998 – 2.91 met its $2.99 smaller than (0.618) projection there is still a reasonable chance for a test of $3.03. However, a move below the $2.91 swing low would wipe out that wave and significantly dampen the odds for $3.03 and higher. Therefore, at this point, a move above either $2.99 or below $2.91 should give us a good idea of the direction for the next few days.

The market remains tight and may continue to oscillate in a narrowing range, but with all factors considered, tomorrow look for a test of $2.90 and possibly $2.87. A close below $2.87 would confirm a break lower out of the flag, opening the way for $2.84 and lower.

Should the $2.91 swing low hold and prices overcome $2.99, near-term odds will shift back in favor of challenging $3.03. A close above $3.03 would confirm a break higher out of the flag and call for $3.08 and ultimately $3.12.

This is a brief analysis for the next day or so. Our weekly Natural Gas Commentary and daily updates are much more detailed and thorough energy price forecasts that cover key natural gas futures contracts, calendar spreads, the UNG ETF, and several electricity contracts. If you are interested in learning more, please sign up for a complimentary four-week trial.

As of December 9, natural gas had risen for the fourth straight week to the highest level in two years. Reports indicate the surge was due to colder than average temperatures in recent weeks. However, on December 12, January natural gas gapped down after the move up stalled at $3.777. The gap may be an early indication the move up is exhausted, though we doubt this is the case.

From a technical and fundamental standpoint, it is much too early to definitively state that the move up is over. Forecasts for persistent cold in coming weeks will most likely continue to support prices and the larger scale wave formations for January, February, and March all call for prices to ultimately rise to at least $3.90.

That said, this does not mean that corrections will not take place. Monday’s gap down was most likely the market coming back to reality a bit. The move up has been hard and fast, and if it is going to be sustained for the longer-term, corrections are necessary.

Since gapping down on Monday, prices have slowly inched lower, indicating the decline is most likely corrective. So far, support at $3.47 has held on a closing basis. However, near-term odds favor at least $3.41. This is the 0.618 projection of the primary wave down from $3.777. A close below $3.41 would open the way for confluent support at $3.36 and then $3.30. Unless there is a bearish shift in underlying factors, we expect $3.30 to hold.

January Natural Gas - $0.035 Kase Bar Chart

Initial resistance is $3.57. If prices are going to fall below $3.41, $3.57 will most likely hold. The most important resistance is $3.66. This is the top of Monday’s gap and near the 62 percent retracement of the decline from $3.777. A close over $3.66 would be a strong indication that the downward correction is complete and that the move up is going to continue its way toward $3.90.

This is a brief natural gas forecast for the next day or so (in this case, a bit longer). Our weekly Natural Gas Commentary and intra-week updates provide a much more detailed and thorough analysis. If you are interested in learning more, please sign up for a complimentary four-week trial.

Natural gas’s recovery from recent lows is reportedly due to forecasts for cooler temperatures that could bring more demand in coming weeks. In addition, prices were bolstered on Wednesday due to a surprise two Bcf withdrawal reported in the EIA Natural Gas Storage Report. However, some analysts have cited record storage levels could still ultimately be bearish for the longer-term.

On Monday, December natural gas formed a potential bullish breakaway gap from $2.852. Bullish breakaway gaps occur when a move down becomes exhausted and prices break higher out of a recent trading range. This is a reversal pattern that could indicate the move down is over, for now.

December Natural Gas

In addition, the 200-day moving average was overcome on Wednesday when December settled at $3.026. This is also bullish and indicates, at a minimum, that an extended upward correction to challenge recent swing highs is likely underway.

The wave formation up from $2.546 met important resistance at $3.062 on Wednesday. A small correction might take place first, but the wave formations are poised for $3.17. This is key resistance because it is in line with the $3.163 swing high, which is also crucial on the continuation chart. It is also the 62 percent retracement of the decline from $3.556 to $2.546. A move above $3.17 ($3.31 for January) is doubtful without help from external factors (i.e. cold weather) but would open the way for new 2016 highs.

That said, December may still try to fill the gap from $2.852. Look for initial support at $2.95 and key support at $2.85. The $2.85 level is not only in line with the gap, but also the 38 percent retracement of the move up from $2.546.

This is a brief natural gas forecast for the next day or so. Our weekly Natural Gas Commentary and intra-week updates provide a much more detailed and thorough analysis. If you are interested in learning more, please sign up for a complimentary four-week trial.

Natural gas has fallen hard ahead of November’s expiration. Speculation that natural gas storage could reach record levels ahead of winter and warmer than normal weather forecasts for the next few weeks are reportedly reasons for falling prices.

Prompt month November futures fell to $2.627 on Wednesday where the 62 percent retracement of the move up from $2.168 to $3.366 was met. Prices rallied into the close and November settled at $2.731. This setup a daily morning star and hammer, which indicates prices may rise to $2.82 and even $2.88 before November expires on Thursday.

The negative outlook has also spilled over into the December contract, which fell below the crucial $3.01 swing low on Wednesday. This was negative because the move below $3.01 takes out what had been December’s primary up wave, $2.37 – 3.368 – 3.01. This significantly dampens the odds for a near-term recovery and a move to new highs.

December natural gas chart

The outlook is negative and there are no definitive technical factors that indicate the move down is over. However, the daily chart is oversold on the KaseCD and setup for a KCDpeak (bullish turn signal). In addition, the 200-day moving average at $2.99 held on a closing basis. These factors and the rally from $2.972 to $3.083 indicate an upward correction to at least $3.13 should take place Thursday. From that point, the move down may continue, or at least test $2.99 again. A close over $3.13 would call for a larger correction to $3.20 and possibly $3.26. This would also indicate a trading range is likely on the horizon.

The 200-day average at $2.99 will be December’s crucial support on Thursday. A close below this would solidify the negative outlook and open the way for $2.93 and lower. Below $2.99, the next major target is $2.82. This is the 62 percent retracement from $2.37 to $3.556.

This is a brief natural gas forecast for the next day or so. Our weekly Natural Gas Commentary and intra-week updates provide a much more detailed and thorough analysis. If you are interested in learning more, please sign up for a complimentary four-week trial.

Natural gas was spurred higher last Thursday after government data showed a smaller than expected build for the week ended October 7. However, the move’s strength and resilience reportedly came as a surprise for many market participants due to mild weather across most of the U.S. The market remains well supplied according to many analysts and rig counts have begun to climb. The natural gas rig count expanded by 11 last week, which is the largest increase since late 2014.

This week, November natural gas prices have fallen to $3.144 so far and settled below major support at $3.21 on Wednesday. The move down stalled just before reaching the next target at $3.12.

The subsequent move up from $3.144 has been shallow, choppy, and is forming a bearish flag. Bearish flags are reasonably reliable patterns that indicate the market should continue to decline. The lower trend line of the flag is $3.15 and the upper trend line is $3.21. The $3.21 level may be tested first but should hold because odds favor a break lower out of the flag.

November 2016 Natural Gas - $0.035 Kase Bar

Tomorrow, look for prices to break lower out of the flag and fall to at least $3.12. A close below this would call for $3.06. For the move up to continue in the near-term, $3.06 must hold. This is the 62 percent retracement of the move up from $2.866 to $3.366. A close below $3.06 would shift odds in favor of testing the $2.866 swing low.

Conversely, a break higher out of the flag and close over $3.21 would call for $3.27 and $3.32. A move above $3.32 would take out the wave down from $3.366 that projects to $3.06 and lower.

This is a brief natural gas forecast for the next day or so. Our weekly Natural Gas Commentary and intra-week updates provide a much more detailed and thorough analysis. If you are interested in learning more, please sign up for a complimentary four-week trial.

Media sources state that traders and analysts are looking to current warm weather in the south and anticipation of a colder than normal winter as catalysts for higher natural gas prices. However, some reports indicate many traders and analysts remain skeptical and have stated that the move up is too soon in anticipation of real weather. These traders and analysts are concerned that an early move higher may lead to disappointment due to inventories that could exceed record levels by the end of this month.

Natural gas’s move up has been resilient and reflects the market’s desire for a longer-term bullish move. The bullish sentiment was reflected by the move to $3.30 on Monday. However, this was a highly confluent wave projection that has held and November has pulled back to $3.184 so far.

From a technical standpoint, there is little doubt that the move down is corrective. The decline has been shallow and choppy and may form a bullish expanding wedge. However, today’s close below Monday’s midpoint and the waves down from $3.30 call for the correction to extend at least a bit more before the move up continues.

ngx6-20161012

Support at $3.18 is still important. A move below $3.18 would call for at least $3.14, which is a confluent wave projection and retracement level. A close below $3.14 would open the way for a more significant correction before prices rise to a new 2016 high.

Resistance at $3.27 must hold for the correction to extend to $3.14. A move above $3.27 before $3.14 is met would indicate the correction is complete and call for prices to rise to crucial targets above $3.30.

This is a brief natural gas forecast for the next day or so. Our weekly Natural Gas Commentary and intra-week updates provide a much more detailed and thorough analysis. If you are interested in learning more, please sign up for a complimentary four-week trial.

WTI has primarily risen on the momentum created by the tentative agreement between OPEC members to cut production by 200,000 to 700,000 barrels per day in coming months. The details of such a deal are still being ironed out and would have to be ratified at OPEC’s meeting in November.

Some traders and analysts reportedly believe that the bullish sentiment from the OPEC announcement is now priced into the market and that further external catalyst is necessary to push prices higher. WTI showed signs of exhaustion last week. However, prices were boosted by an unexpected decline in U.S. crude oil inventories late in the week and rose to $51.6 on Monday.

OPEC detractors remain skeptical because much of the world’s oil is now produced outside of the cartel. Many pundits believe that it will take more than OPEC cuts to stabilize oil prices. To that end, Saudi Arabian and Russian officials are set to meet in Istanbul this week to discuss such matters. However, several reports indicate comments made by Russia’s energy minister dampened hopes that an agreement would be reached during their meeting.

The technical outlook for WTI is bullish, but there have been a few signs of weakness. The recent wave formation up from $43.06 is overextended, the Stochastic is overbought, and most momentum indicators are setup for daily bearish divergences. Although there is no definitive technical evidence the move up will stall, a correction should take place soon.

November is approaching key resistance at $52.6. This is the point at which the wave formation up from contract low connects with the wave up from early August’s low. $52.6 is the 0.618 projection for the wave $34.1 – 53.39 – 40.77 and the 1.00 projection for the wave $40.77 – 50.0 – 43.06. A close over $52.6 would open the way for a longer-term bullish outlook with targets in the upper $50s and low $60s. WTI should rise to $52.6. However, given the importance of this level, we expect to see a correction before $52.6 is overcome.

clx6-20161010

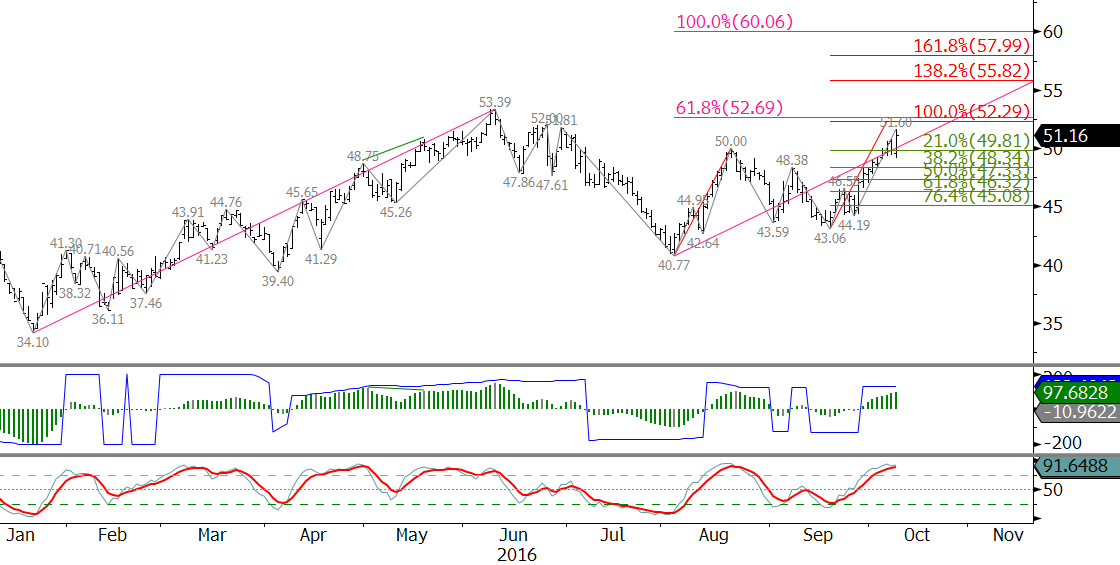
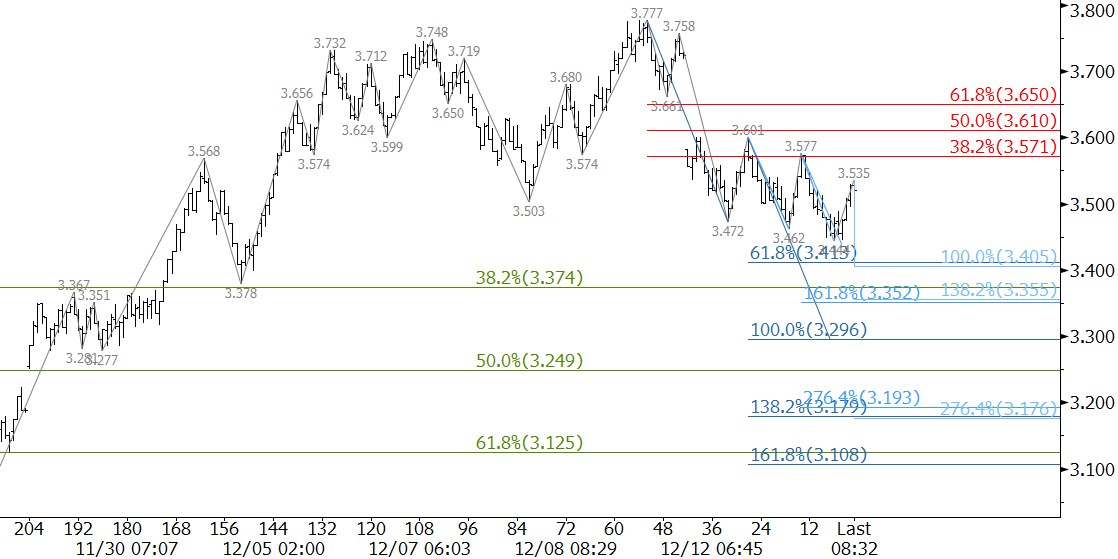
Should prices turn lower before rising to $52.6, look for initial support at $50.5 and then $49.6. A close below the latter would call for an extended correction to $48.3. A normal correction should hold $48.3 because it is the 38 percent retracement of the move up from $43.06. A close below this would call for a more substantial correction before the move up continues.

This is a brief analysis and outlook for the next day or so. Our weekly Crude Oil Commentary and intra-week updates are a much more detailed and thorough energy price forecast. If you are interested in learning more, please sign up for a complimentary four-week trial.