Crude Oil Forecast: WTI Setting Trading Range Boundaries

By Dean Rogers

WTI crude oil is settling into a trading, the boundaries of which will be determined over the next week or so. It is still too early to state the exact boundaries. Technical factors tell us the range will likely be set between resistance at $50.5 and support at $42.5. This is a wide, but typical, range for crude oil.

For the next day or so look for prices to rise to at least $46.4 and possibly $47.2. Both are confluent wave projections and retracements. $46.4 is also in line with Monday’s $46.41 swing high.

KaseX confirms Tuesday’s move up with a filtered long signal (green diamond) on the $0.50 Kase Bar chart shown below.

wti crude oil

First support is $44.9 then $44.5 and $43.6. A close below $44.5 would shift odds in favor of at least $43.6 and very likely $42.5.

This is a brief analysis and outlook for the next day or so. Our weekly Crude Oil Commentary is a much more detailed and thorough energy price forecast. If you are interested, please sign up for a complimentary four week trial.

Mon1By Cynthia A. Kase

Read on TraderPlanet.com

Six big firms dominate the agricultural supply business today, having bought up over 200 smaller companies and their intellectual property over the past 25 years or so. Monsanto, the world’s largest seed supplier, and BASF both reportedly tried to buy rival Syngenta. Though no deals went through, it looks like the industry is in for another round of consolidation. One of Monsanto’s problems is that weeds are becoming resistant to its star product, Roundup, and commodity prices are down, reducing farmers’ ability to pay for its goods. A merger would help by giving it economies of scale which could improve its both prices and its pace of innovation.

The Monsanto stock price itself is now about 30 percent off its post-recession $128.79 high. Is Monsanto stock in the weeds or will it round UP?

Analysis

I’m biased to the downside primarily for these bearish reasons. The last four days, following last Wednesday’s big up day, have been stars, or small open-close range days. There was a possible breakaway gap down this morning. Kase’s daily upper stop has held. Momentum is non-divergent. The two most recent signals on KaseX, purple diamonds, were sell signals. All these are shown in the chart below.

mon2


Charts created using TradeStation. ©TradeStation Technologies, Inc. 2001-2015. All rights reserved. No investment or trading advice, recommendation or opinions are being given or intended.

If the $10 recovery lengthens, it’s no big deal if $98 is tested. The price to watch is $101. There’d have to be a three sigma move of the daily double TrueRange for $101 to be hit. This is also the minimum, 0.62 extension for the bounce from $89.34 to $99.48, and the midpoint of the candlestick for the week ending August 7. Above this, there’s heavy resistance in the $105 to $107 area, but odds then swing in favor of a recovery right back to May’s highs of $123 plus.

The decline to $89.34 was about $0.75 shy of $88.6 support, which must be clearly broken for a continuation lower. $88.6 is the 1.62 extension for the major recent wave is 128.79 – 105.76 – 126.0, and the 1.38 extension for the first wave down from $123.82. The trend terminus for both these waves is $71.25. Importantly, the correction from $89.34 to $99.48 targets $88.6 as the Phi-cubed projection. $88.6 is Kase daily DevStop2 and weekly DevStop1, so it is confluent statistically.

It’s not unusual for trending patterns elongate in such a way as to stretch key targets to more extreme levels. This is what’s happened for Monsanto. After falling from $128.79 to $105.76 in 2014, prices recovered to $126 earlier this year. Waves down from $126 have pushed the major downside target to$86.7. This is the “trend terminus” for the wave from $126.0 to $111.16, and the 1.0 extension from $126.0 to $103.14. Very importantly, $86.7 is the 50 percent retracement of the entire move up from the recession low of $44.61.

Outlook

Structurally, there’s a reasonable chance for $86.7 holding support, otherwise, I’d look for a free fall to $71.25. Below that don’t get lost after landing in the weeds!

Send questions for next week to askkase@kaseco.com, and click the link learn more about KaseX and the Kase DevStops.

By Dean Rogers

Many market participants are skeptical of Brent’s meteoric rise over the past three days. However, there is no denying the positive technical factors that indicate a bottom has likely been made. The monthly morning star setup and hammer, weekly bullish engulfing line, and daily three white soldiers candlestick patterns are reliable reversal patterns. KaseX also triggered reversal signals (gray arrows) early last week.

Brent Oil

Brent is on the teetering edge of confirming a sustained bullish outlook and has risen to the 50-day moving average at $54.47, the 38 percent retracement from $71.68, and the upper standard deviation band. A close over $54.5 will confirm a positive outlook and call for $55.4 and higher.

That said, because of the confluence of technical resistance at $54.5 this is a very likely stalling point. We expect a test of support at $51.9 within the next few days and likely before Brent closes over $54.5. A close below $51.9 would call for $50.6 and $49.7. The latter must hold for the near-term outlook to remain positive.

This is a brief Brent oil forecast and outlook for the near-term. Our weekly Crude Oil Commentary is a much more detailed and thorough energy price forecast. If you are interested, please sign up for a complimentary four week trial.

hogsby Cynthia A. Kase

Read on TraderPlanet.com

After last year’s viral outbreak that killed millions of hogs, pork production, now having recovered, looks to set records and overshoot demand. Apparently some commodity advisors are panicking and recommending that their producer clients use lean hog futures to hedge and avoid even lower prices. Is this a good idea?

To our view, hedging hogs today would be like closing the sty door after the pig has fled. In Kase’s energy practice, producers hedge when markets are enjoying high prices, not when already painfully low. At this point, defensive measures are called for.

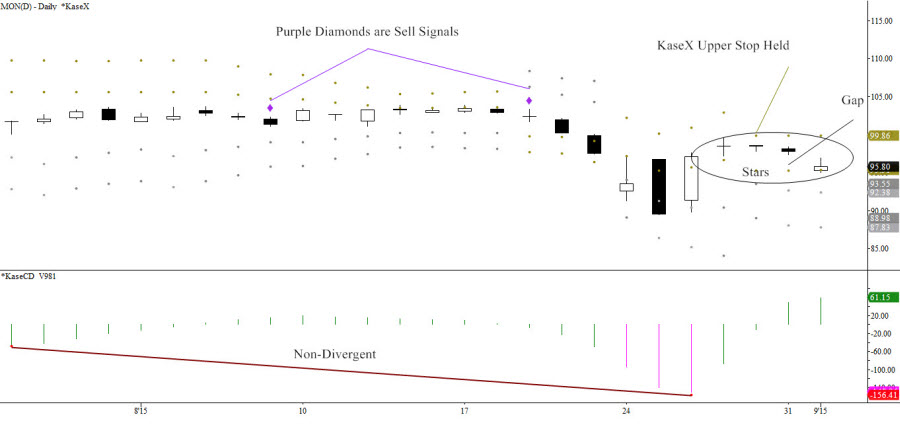
The reason I’d be a reluctant outright seller or short hedger is that prices have been rising over the past few weeks, not falling. Looking at the August 2015 contract, prices fell from a 95.35 high last November to a 71.175 low June 22. Then the KasePO and KaseCD momentum indicators generated bullish oversold and momentum divergence signals. A 71.275 swing low followed, forming a classic “W” shape, or double bottom.

lean hogs

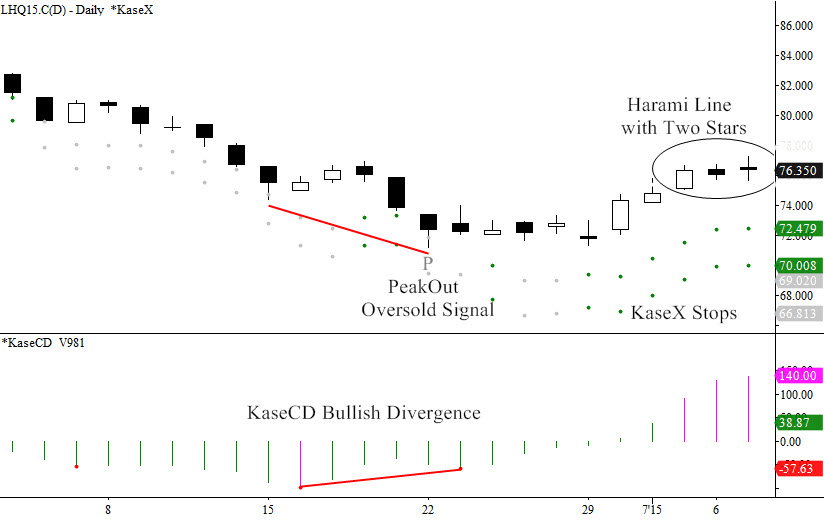
Last week’s candlestick completed a classic bullish morning star. However, the pattern remains unconfirmed until a close over 76.65, dampening the bullish tone. Also, the daily chart shows a potentially negative Harami line with two stars.

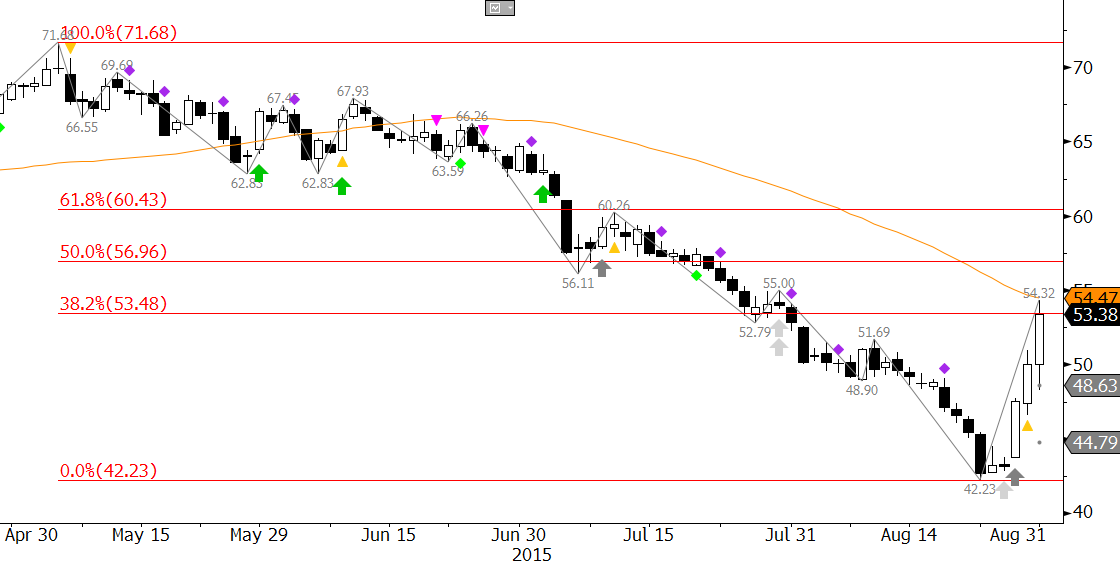
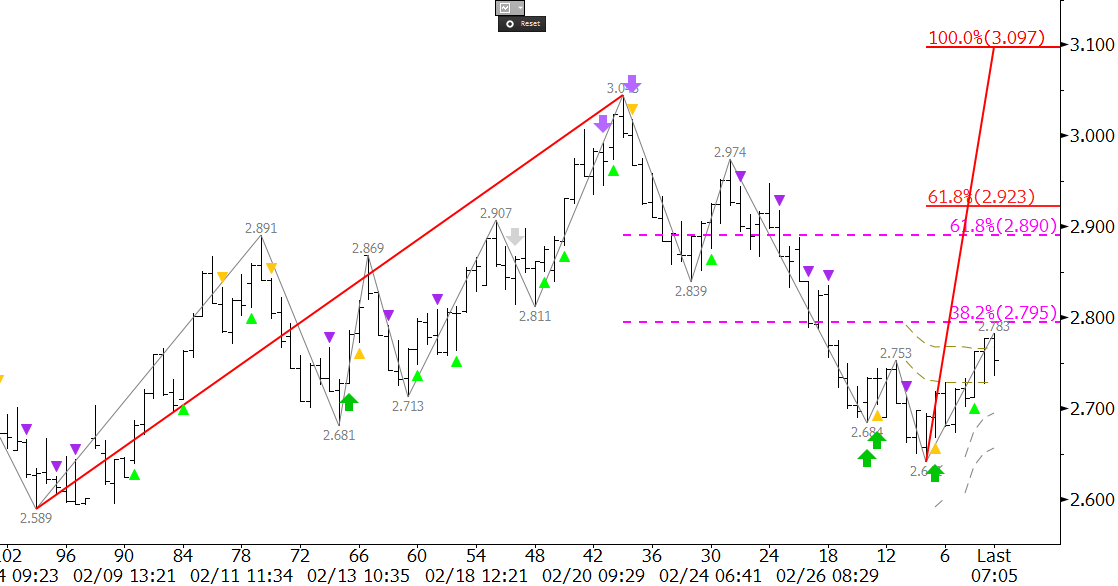
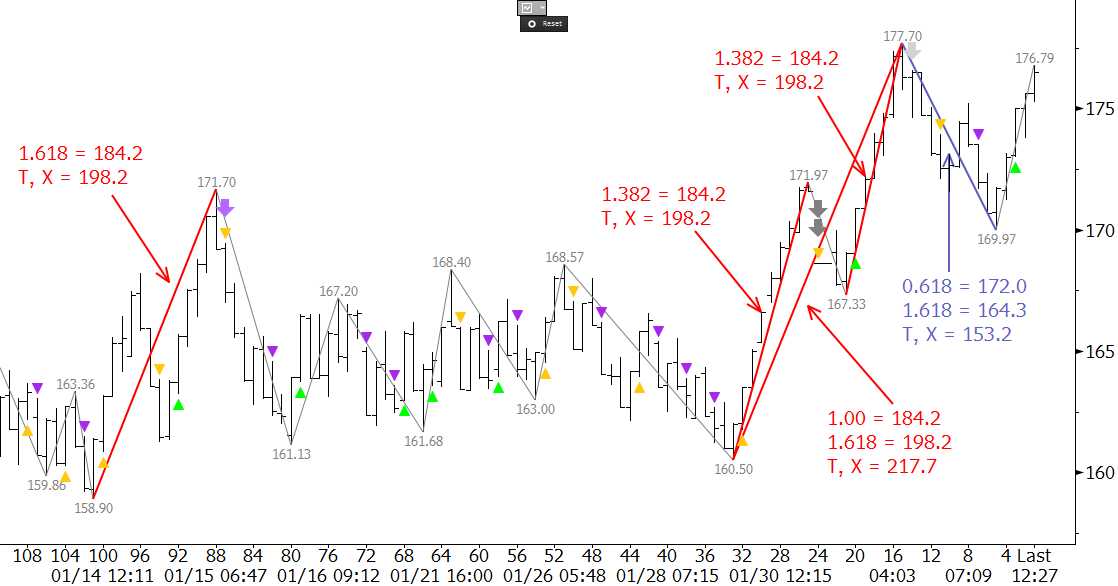
While the overall structure is down, the current 6 cent bounce could continue to 79 and maybe 81.5. A close over 81.5 hasn’t high odds right now, but if it happens we could see another 10 cents. 79 is the 2*1.38 extension and Phi2 corrective projection for 71.175 – 74.05 – 71.275. For the final wave up spanning from July 2 to July 7, 75.175 – 77.275 – 75.625, 79 is the 1.62 extension and 81.5 is both the trend terminus (77.2753/75.1752), and 2*1.38 extension.

If there isn’t a close over 76.65 soon, the rally might fail. A close below June 2s open, 75.15, followed by 72.4 would be cause for concern. A close below 70 could send lean hog prices squealing – potentially to 55 cents as, from a technical standpoint, targets ranging from 67 down to 55 have similar odds.

72.4 and 70 are KaseX stops. The key wave, 95.35 – 86.00 – 90.65, targets 70 as the important 1.62 extension. The last down wave, 77.275 – 75.625 – 76.625 targets 72.4 as the trend terminus (77.2753/75.6252), 2*1.38 extension and Phi3 corrective projection.

Here’s my hedging strategy. If you’re ok with “getting called”, sell calls above the market, maybe just above 81.5, perhaps purchasing puts on the downside with the funds depending on your risk appetite and whether you need to qualify for hedge accounting. Otherwise wait for a drop below 75.15 or so, then scale-in short calls maybe five cents or so above the market, again possibly buying puts. Meanwhile, grab a beer and a brat and watch the thresholds.

Send questions for next week to askkase@kaseco.com, and for energy hedging visit the Kase Energy Hedging Services page.

Charts created using TradeStation. ©TradeStation Technologies, Inc. 2001-2015. All rights reserved. No investment or trading advice, recommendation or opinions are being given or intended.

Cold weather continues to support natural gas, but the wide sweeping frigid conditions have not been enough of an influence to drive prices higher. Fundamental and technical factors leave little doubt that the outlook for the next several months is bearish, but for now, natural gas prices are stuck in a trading range bound between approximately $2.55 and $3.00.

Prices fell last week after the disappointing U.S. Energy Information Administration (EIA) Natural Gas Weekly Update, and a swing low of $2.641 was made on Tuesday. The $2.80 midpoint of last Thursday’s candlestick held Wednesday morning, which may be an early indication that another disappointing EIA update is expected tomorrow. The $2.80 level is confluent resistance because it is also the 38 percent retracement of the decline from $3.045 to $2.641.

There are a few short term positive factors (green arrow and triangle) triggered by KaseX on the $0.05 KaseBar chart, and a close over $2.80 would open the way for key resistance at $2.90. The $2.90 level is the 62 percent retracement from $3.045 and the 0.618 projection for the wave $2.589 – 3.045 – 2.641. This is crucial, because waves that overcome the 0.618 projection typically extend to at least the 1.00 projection, in this case $3.10. We expect $2.90 to hold, but a close over this level would shift near term odds in favor of another attempt at $3.10 and higher.

Natural Gas Forecast

First support is $2.70, and a move below this would call for the $2.641 swing low and $2.589 contract lows to be challenged. The most important target is still $2.55, because the technical show that it is the gateway objective for a decline into the low $2s. It will likely be at least a few more weeks before prices close below $2.55.

So for now, our analysis leads us to believe that a near term test of resistance at $2.80 and possibly $2.90 will take place, but that $2.90 will hold and prices will continue to oscillate in a sideways range.

Kase Bars are available on TradeStation and Bloomberg.

Take a trial of Kase’s in-depth weekly Natural Gas Forecast or of KaseX.

Natural gas’ decline stalled at $2.567 on February 6. This was near the very crucial bearish decision point of $2.52. Subsequently prices have risen to $2.857. The market is likely settling into a range that is being supported by external factors (i.e. cold weather), but is searching for the upper end of this range.

A confirmed daily morning star and a few weak momentum signals (white arrows) on KaseX indicate the upward correction should extend. However, the correction met and held the 38 percent retracement from $3.299 to $2.567 at $2.85. In addition, KaseX has already generated a short warning (yellow down triangle), and prices are sitting just below the crucial $2.79 level. The $2.79 level has been major support for week, and it is now key resistance. It was tested one and held already on February 3, so a close over this would be positive for the near term.

Natural Gas Rise

Overall, the charts and technical factors discussed indicate that traders are anticipating a bullish U.S. Energy Information Administration (EIA) Natural Gas Weekly Update tomorrow. However, there is some uncertainty to this move, which is why prices backed off the $2.857 swing high morning and are hovering around $2.79.

A close over $2.79 would open the way for $2.85 again, and likely $3.02, which is the 62 percent retracement from $3.299. The $3.02 level should hold unless tomorrow’s EIA number is much more bullish than anticipated. A close below $2.79 would call for $2.68 to be challenged. This is the 62 percent retracement from $2.567 to $2.857. A close below this would then call for another test of the $2.52 decision point.

More information about KaseX.

Take a trial of Kase’s Award Winning Weekly Energy Forecasts.

NY Harbor ULSD future’s upward correction extended to 177.7 on Monday. The primary wave 158.9 – 171.7 – 160.5, met its 1.382 projection at 177.7 and is poised to extend to the 1.618 projection of 184.2. This is the decision point for an extended correction and potential recovery. Although it is too early to say that a bottom has been made, a sustained close over 184.2 would open the way for 198.7 and 217.7. A close below 164.3 would indicate the upward correction is complete and call for 153.2 and lower.

To learn more about Kase’s forecasts please visit the Energy Price Forecasts Page.

HO


Last week’s natural gas price rise was poised to fill December 22nd’s gap from $3.48, but the upward correction stalled at $3.352. The week settled above the $3.09 midpoint of Wednesday, January 12th’s candlestick, leading to speculation that the market might try to rise again early this week. However, Monday’s intraday gap down from $3.056 and settle back below $3.00 was negative for the near-term outlook.

There is still major support at $2.80 that has held so far, but after this morning’s move up stalled and failed to fill to $3.056 gap it looks as though a bearish U.S. Energy Information Administration (EIA) Natural Gas Weekly Update is expected tomorrow.

The key wave for the short-term is $3.352 – 3.024 – 3.228. This wave has already fallen below its 1.00 projection at $2.90 and is poised to meet at least its 1.382 projection at $2.77. This then connects to $2.66 as the 1.618 projection. The $2.66 target is highly confluent for many of the larger and earlier waves down, and is the 0.618 projection for the wave $3.95 – 2.783 – 3.352. The confluence is important because a sustained close below $2.63 would open the way for a decline into the mid-to-low $2’s over the course of the longer-term. Therefore, $2.63 is a potential stalling point for the decline.

nat gas

The KaseX indicator on the 240-minute equivalent Kase Bar (KBAR) also confirms the negative outlook and has generated several short signals (purple arrows) during the decline from $3.352. The most recent short signal came after the $3.015 swing high this morning. At this point, there are no warning signals that indicate profit should be taken or that short trades should be exited. This will likely change though should prices recover above the $3.015 swing high.

First resistance ahead of the EIA report is $3.06, which is near the top of the $3.056 gap. A move above this would call for 3.15, which is the 0.618 projection for the wave $2.783 – 3.352 – 2.821. The $3.15 level is confirmed as the 62 percent retracement from $3.352 to $2.821. It is also interesting to note that this morning’s rise to $3.015 stalled just below the 38 percent retracement at $3.02. This is another negative factor.

To summarize, the bias is negative, and the move down is expected to continue. There is strong support at $2.80, but a move below this would call for at least $2.77 and very likely $2.66. Resistance at $3.06 will likely hold, but a move above that would open the way for at least $3.15.

For more information about KaseX please visit our Trading Indicators Page. To take a trial of Kase’s in-depth weekly energy forecasts on natural gas and crude oil please visit the Energy Forecasts Page.


Brent has been trading in a corrective range for the past several days, but fell to major support at $47.7 on Tuesday. This is the 0.618 projection for the wave $52.42 – 48.07 – 50.41. The $47.7 projection connects to a major target at $45.8 as the 1.00 projection. This is also the 1.618 projection for the largest and most important wave down from the $111.38 contract high. KaseX confirms the negative call with confirmed short signals (purple triangles) on the 120-minute equivalent Kase Bar chart.

For more information about KaseX please visit our trading indicators page. The learn about our forecasts please visit our energy forecasts page.

Brent

The NY Harbor ULSD futures broke lower out of a bearish flag formation on Monday. The break lower was anticipated and then confirmed by KaseX short signals. The decline is now poised to extend to at least 188.9 and then 177.9. The latter is crucial because a close below this would call for 164.1 and 151.9. Initial resistance is the small intraday double top at 199.39. A close over this would open the way for an extended correction to 210.9 and possibly 226.0.

For more information about KaseX please click here.

For more information about Kase’s weekly energy forecasts please click here.

HO1