Gold Price Forecast – December 3, 2020

Gold Technical Analysis and Near-Term Outlook

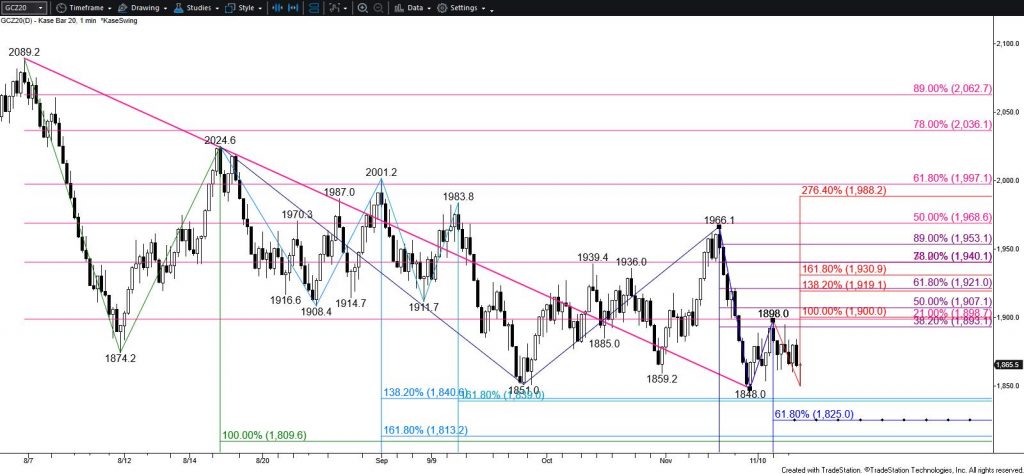
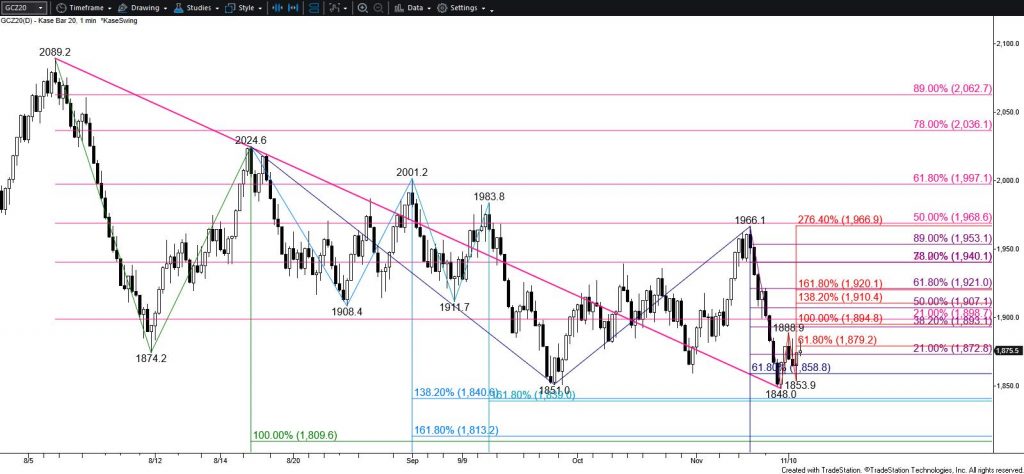
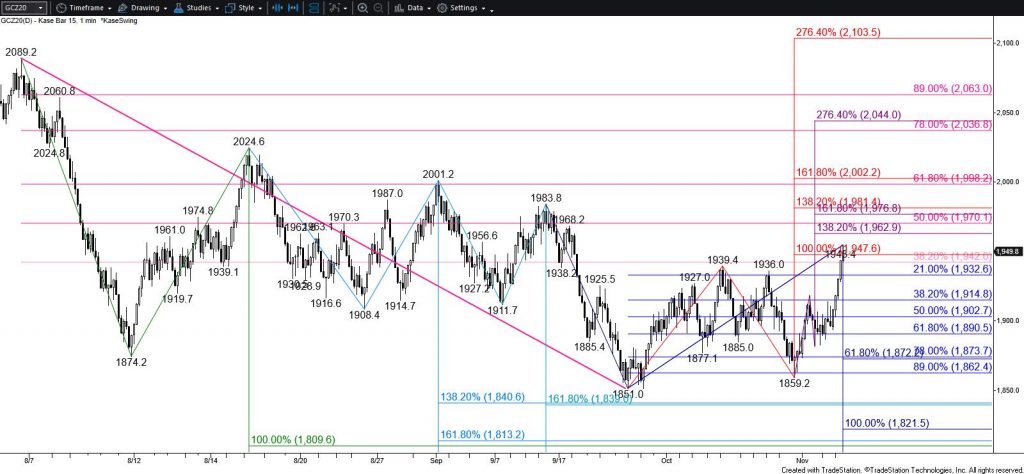
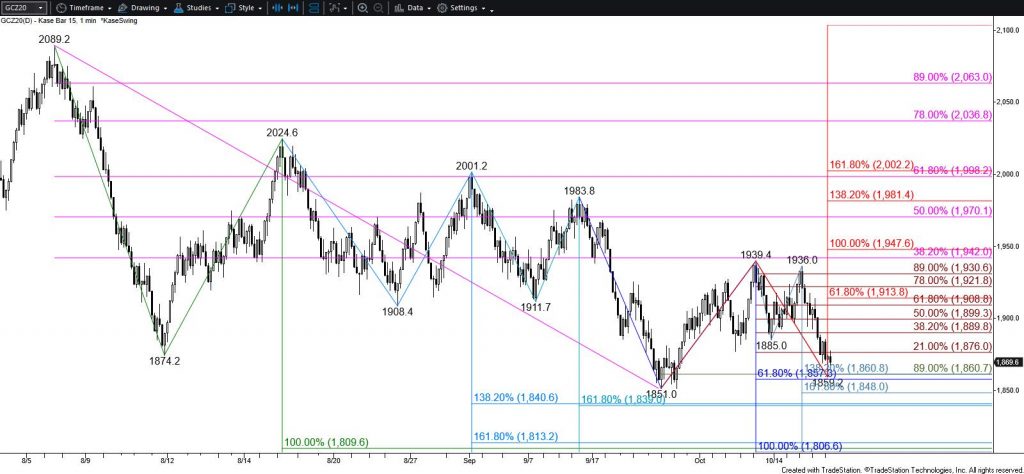
Gold rose to challenge $1849 resistance as called for in yesterday’s update. This level, which is split between the 38 percent retracement of the decline from $1973.3 and the 62 percent retracement from $1904.3, has held so far. Nonetheless, near-term odds still favor a continued rise due to the sustained close back above the 200-day moving average and settle (so far) above last week’s $1832 midpoint. Overcoming $1849 will call for $1862 and possibly $1872 ahead of the weekend. Key resistance and the barrier to a firm bullish near-term outlook is $1894. This is the 62 percent retracement of the decline from $1973.3 and the 38 percent retracement from $2099.2.

Gold - Daily Candlestick Chart
Gold – Daily Candlestick Chart

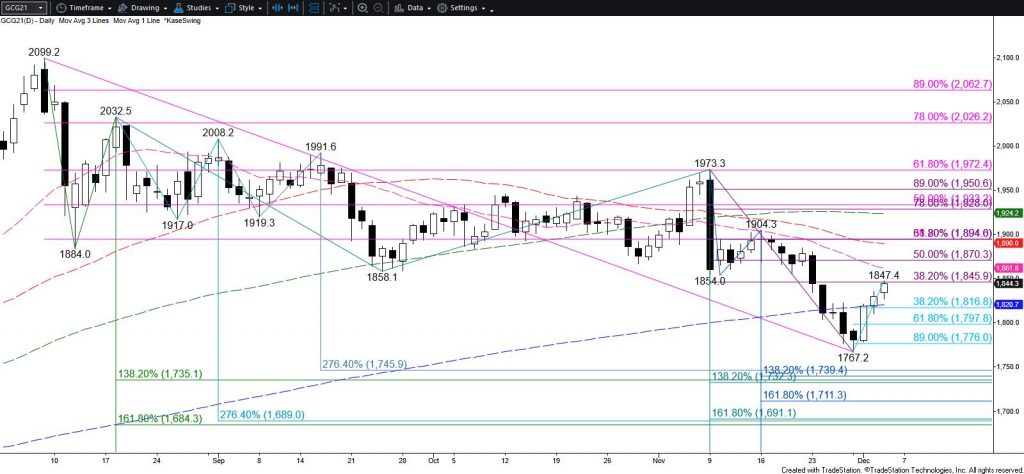
With that said, gold’s move up from $1767.2 lacks a wave that can support a larger rally. The retracements that have taken place during the move up have been minimal. It is rare to see a market rise above crucial resistance without an adequate wave structure. Also, due to the importance of $1849, there is a reasonable chance for a pullback to test support ahead of the weekend. This is the challenge for gold’s near-term outlook because a pullback large enough to create a wave that can sustain a larger rally will have to test the 38 percent retracement of the rise from $1767.2 around $1819. This is in line with the 200-day moving average, a close below which would signal that bears are taking control again. Settling below $1798 will confirm this and shift near-term odds in favor of $1776 and lower next week.

This is a brief analysis for the next day or so. Our weekly Metals Commentary and daily updates are much more detailed and thorough energy price forecasts that cover key COMEX precious metals futures contracts and LME Non-Ferrous (Base) metals, spot gold, the gold/silver ratio, and gold ETFs. If you are interested in learning more, please sign up for a complimentary four-week trial.

Gold Technical Analysis and Near-Term Outlook

The near-term outlook for gold remains bearish after holding resistance around $1898 and taking out the $1853.9 swing low today. The move down will likely be a grind for the interim, but the wave formations call for $1843. Settling below this will clear the way for $1825 and then the next major objective and probable stalling point at $1810.

Nonetheless, support around $1850 +/- $2 has been resilient since late September. The $1848.0 swing low held and today’s hammer suggests another test of resistance might take place first. Overcoming $1881 will call for key near-term resistance at $1900. Closing above $1900 would shift near-term odds in favor of $1920 and likely higher.

Gold - $20 Kase Bar Chart
Gold – $20 Kase Bar Chart

This is a brief analysis for the next day or so. Our weekly Metals Commentary and daily updates are much more detailed and thorough energy price forecasts that cover key COMEX precious metals futures contracts and LME Non-Ferrous (Base) metals, spot gold, the gold/silver ratio, and gold ETFs. If you are interested in learning more, please sign up for a complimentary four-week trial.

Gold Technical Analysis and Near-Term Outlook

The outlook for gold is bearish and the move down is still in a position to eventually reach $1814. This is the equal to (1.00) target of the primary wave down from $2089.2. The connection to $1814 is made through $1854 and $1841.

Nevertheless, today’s $1883.0 high fulfilled the smaller than (0.618) target of the wave up from $1848.0. Therefore, there is a reasonable chance for gold to reach the $1895 equal to (1.00) target before the decline continues. This is also in line with the 38 percent retracement of the decline from $1966.1 and the 21 percent retracement of the decline from $2089.2. For the move down to continue during the next few days $1895 must hold. Closing above this will call for a test of key near-term resistance at $1921. Settling above $1921 would reflect a bullish shift in near-term sentiment and call for another substantial test of resistance before the decline continues.

Gold - $20 Kase Bar Chart
Gold – $20 Kase Bar Chart

This is a brief analysis for the next day or so. Our weekly Metals Commentary and daily updates are much more detailed and thorough energy price forecasts that cover key COMEX precious metals futures contracts and LME Non-Ferrous (Base) metals, spot gold, the gold/silver ration, and gold ETFs. If you are interested in learning more, please sign up for a complimentary four-week trial.

Gold Technical Analysis and Near-Term Outlook

Gold rallied and settled above the 50-day moving average and the 38 percent retracement of the decline from $2089.2. This is bullish for the near-term outlook and reflects a positive shift in near-term sentiment. The move up is now poised to challenge $1963, $1979, and possibly $1999 during the next few days. The $1999 objective is most important because this is the 62 percent retracement and the larger than (1.618) target of the primary wave up from $1851.0.

With that said, the $1948 equal to (1.00) target of the same wave up from $1851.0 held on a closing basis today. Therefore, a test of support might take place before gold challenges $1963. Initial support at $1925 is today’s midpoint and is expected to hold. Key support is $1903, today’s open and the 50 percent retracement of the rise from $1851.0. Closing below $1903 during the next few days will shift odds back in favor of $1873 and lower.

Gold - $15 Kase Bar Chart
Gold – $15 Kase Bar Chart

This is a brief analysis for the next day or so. Our weekly Metals Commentary and daily updates are much more detailed and thorough energy price forecasts that cover key COMEX precious metals futures contracts and LME Non-Ferrous (Base) metals, spot gold, the gold/silver ration, and gold ETFs. If you are interested in learning more, please sign up for a complimentary four-week trial.

Gold Technical Analysis and Near-Term Outlook

Gold settled below the 100-day moving average for the second straight day and challenged the $1857 target as called for in yesterday’s update. This confluence point is split around the smaller than (0.618) target of the wave down from $1983.8, the 89 percent retracement of the rise from $1851.0, and the intermediate (1.382) and larger than (1.618) targets of the wave down from $1939.4. This may prove to be a temporary stalling point but fulfilling the $1857 objective is bearish for gold’s outlook.

Closing below $1857 will clear the way for $1841 and then the next major objective at $1810. The $1810 objective is the equal to (1.00) target of the primary wave down from $2089.2. Once met, another significant test of resistance is expected before gold falls any lower.

Gold - $15 Kase Bar Chart
Gold – $15 Kase Bar Chart

As stated, due to the confluence of $1857, a test of resistance might take place before falling to $1841 and lower. Resistance at $1893 is expected to hold and $1913 is key for the near-term. Settling above $1913, the smaller than target of the wave up from $1851.0, will shift near-term odds in favor of rising to the $1948 equal to target before the decline continues.This is a brief analysis for the next day or so. Our weekly Metals Commentary and daily updates are much more detailed and thorough energy price forecasts that cover key COMEX precious metals futures contracts and LME Non-Ferrous (Base) metals, spot gold, the gold/silver ration, and gold ETFs. If you are interested in learning more, please sign up for a complimentary four-week trial

Gold Technical Analysis and Near-Term Outlook

Gold continues to trade erratically but retains a bearish outlook. Today’s failure to reach $1942 and the move below $1902, the smaller than (0.618) target of the wave down from $1939.4, has shifted near-term odds back in favor of testing $1882. This objective is key because taking out $1882 will clear the way for the next leg of the move down to challenge $1859, $1840, and eventually $1810.

Gold - $15 Kase Bar Chart
Gold – $15 Kase Bar Chart

Nonetheless, because gold overcame the smaller than targets of the waves up from $1851.0 and $1877.1, there is still a reasonable chance for a test of $1950 before the decline continues.

Should gold settle back above $1925 before taking out $1882 look for a test of $1950. The $1950 level is expected to hold. Closing above this would warn that a bullish reversal is underway and would significantly dampen odds for a continued decline.

This is a brief analysis for the next day or so. Our weekly Metals Commentary and daily updates are much more detailed and thorough energy price forecasts that cover key COMEX precious metals futures contracts and LME Non-Ferrous (Base) metals, spot gold, the gold/silver ration, and gold ETFs. If you are interested in learning more, please sign up for a complimentary four-week trial.

Gold Technical Analysis and Near-Term Outlook

The outlook for gold remains bearish and the move up from $1877.1 is most likely corrective of the recent decline from $1927.0. Closing below $1879 will clear the way for $1855 and lower. Nonetheless, there is a modest chance for a larger test of resistance first, but $1908 is expected to hold.

Gold - $15 Kase Bar Chart
Gold – $15 Kase Bar Chart

Gold’s recent decline from $1927.0 stalled near the 62 percent retracement of the rise from $1851.0. The subsequent move up has been shallow and choppy and is most likely forming a bearish flag that is poised to break lower during the next day or so. Closing below $1879 will confirm that the move down is extending again and will call for $1855 and then $1842. The $1842 level is most important for the near-term because a close below this will clear the way for the next major objective at $1812.

With that said, the small waves up from $1877.1 suggest a test of $1908 might take place first. This is the 62 percent retracement of the decline from $1927.0 and is expected to hold. Closing above $1908 will call for $1924, the smaller than target of the wave up from $1851.0. This is a key threshold for the near-term because a close above $1924 will clear the way for $1942 and likely $1955.

This is a brief analysis for the next day or so. Our weekly Metals Commentary and daily updates are much more detailed and thorough energy price forecasts that cover key COMEX precious metals futures contracts and LME Non-Ferrous (Base) metals, spot gold, the gold/silver ration, and gold ETFs. If you are interested in learning more, please sign up for a complimentary four-week trial.

Gold Technical Analysis and Near-Term Outlook

The near-term outlook for gold is bullish after settling above the $1851.0 double bottom’s $1911 target today. The move up is poised to reach $1938. This is the highest the wave up from $1851.0 projects and is in line with the 38 percent retracement of the decline from $2089.2. Gold will likely be hard-pressed to close above $1938 without a test of support first. Therefore, once $1938 is met odds for a significant test of resistance will rise to better than even. Nevertheless, closing above $1938 would warn that the move down from $2089.2 might be complete and would call for $1958 and higher.

Gold - $15 Kase Bar Chart
Gold – $15 Kase Bar Chart

Should gold turn lower before reaching $1938 look for initial support at $1892 and key near-term support at $1877. Closing below $1877 will shift odds back in favor of challenging $1851 and then $1840.

This is a brief analysis for the next day or so. Our weekly Metals Commentary and daily updates are much more detailed and thorough energy price forecasts that cover key COMEX precious metals futures contracts and LME Non-Ferrous (Base) metals, spot gold, the gold/silver ration, and gold ETFs. If you are interested in learning more, please sign up for a complimentary four-week trial.

Gold Technical Analysis and Near-Term Outlook

The outlook for December COMEX gold is bearish after breaking lower out of a coil pattern last week and settling below a crucial $1888 objective on Wednesday. The sustained close below $1888, the smaller than (0.618) target of the primary wave down from $2089.2, calls for gold to reach the $1810 equal to (1.00) target in the coming days.

Gold - $15 Kase Bar Chart
Gold – $15 Kase Bar Chart

However, there is strong near-term support around $1843. This is the most confluent wave projection and is in line with the 38 percent retracement of the move up from $1458.8. Today’s formation of a hammer also suggests that a larger test of resistance might take place before the decline continues.

The $1888 level has become initial resistance and will likely hold. However, the increase in volatility during the past few days could help drive gold to challenge $1905. These are the completion and confirmation points for today’s hammer pattern, respectively. Settling above $1905 is doubtful but would dampen odds for a continued decline during the next few days and would shift near-term odds in favor of challenging $1930 and possibly $1954.

This is a brief analysis for the next day or so. Our weekly Metals Commentary and daily updates are much more detailed and thorough energy price forecasts that cover key COMEX precious metals futures contracts and LME Non-Ferrous (Base) metals, spot gold, the gold/silver ration, and gold ETFs. If you are interested in learning more, please sign up for a complimentary four-week trial.

Gold Technical Analysis and Near-Term Outlook

The near-term outlook for gold is bearish after finally breaking lower out of a coil pattern and settling below the pattern’s lower trend line. Gold also settled below the 20-day moving average. The move down is now poised to reach at least $1929. This is the smaller than (0.618) target of the wave down from $2001.2 and connects to a key objective at $1892 as the equal to (1.00) target. The $1892 objective is also the smaller than target of the primary wave down from $2089.2. Settling below this would be quite bearish for the outlook in the coming weeks.

Gold - Daily Coil
Gold – Daily Coil

Nevertheless, a move up at the end of the day suggests gold might test the lower trend line of the coil before the decline continues. Tomorrow, this trend line will intersect with $1964 resistance and is expected to hold. Rising above this would call for another attempt at $1983, the smaller than target of the wave up from $1911.7. Settling above $1983 would imply that today’s move down was another false breakout and would clear the way for $2005 and likely higher.

This is a brief analysis for the next day or so. Our weekly Metals Commentary and daily updates are much more detailed and thorough energy price forecasts that cover key COMEX precious metals futures contracts and LME Non-Ferrous (Base) metals, spot gold, the gold/silver ration, and gold ETFs. If you are interested in learning more, please sign up for a complimentary four-week trial.