Gold Price Forecast – February 25, 2021

Gold Technical Analysis and Near-Term Outlook

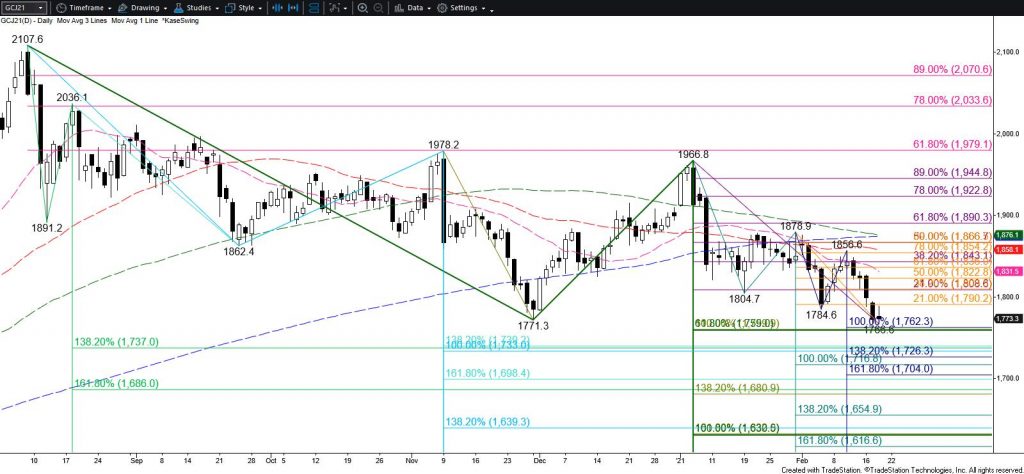
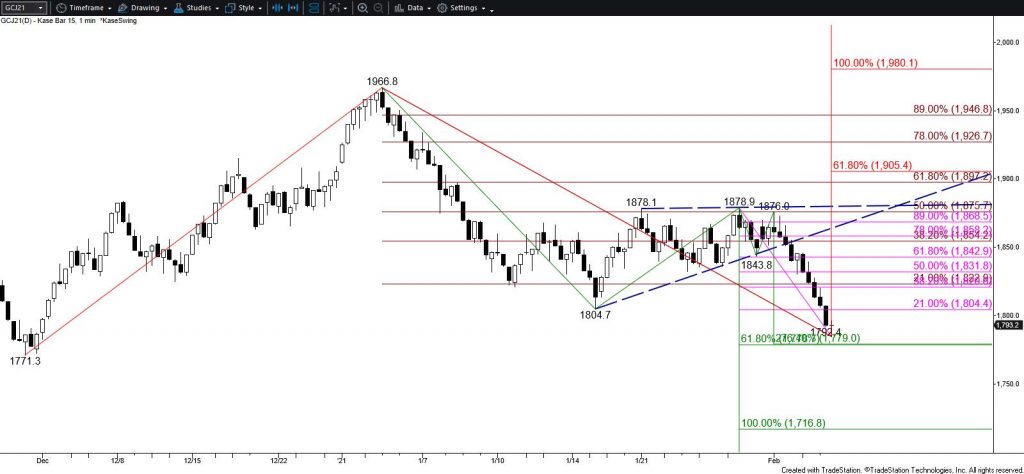
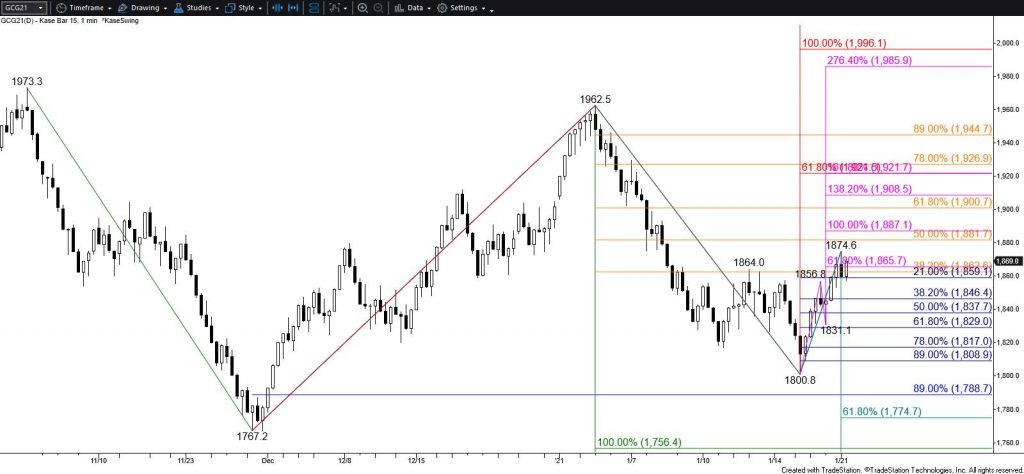
Gold settled below crucial near-term support at $1780. This has positioned gold to challenge the $1759 swing low again. This is a bearish decision point for the long-term because $1759 is the smaller than (0.618) target of the primary wave down from $2107.6. Based on the more recent waves, the $1759 confluence point is lowered to $1756 +/- $4. This objective is expected to be challenged tomorrow. Closing below $1756 will substantially increase odds for a decline to the primary wave’s $1631 equal to (1.00) target in the coming weeks. For the near-term, a close below $1756 will clear the way for $1737, $1720, and $1695.

Gold - $10 Kase Bar Chart
Gold – $10 Kase Bar Chart

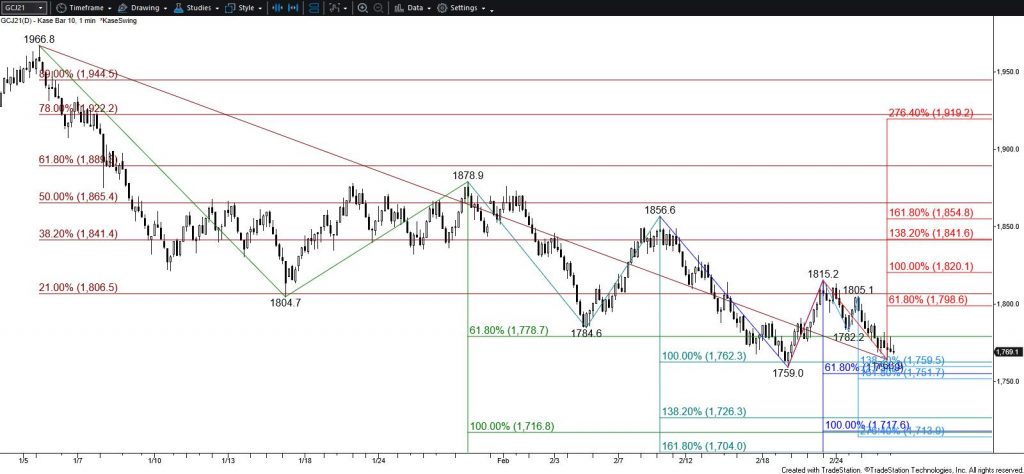
The $1756 target is the most confluent objective on the chart, so there is a modest chance that a double bottom could form around this area. There are no bullish patterns or signals that call for a double bottom to take shape, but this must be considered given the importance of the $1756 target.

With that said, should $1756 hold and gold rise above $1786 look for a test of key near-term resistance at $1799. This is currently the smaller than target of the wave up from $1759 and the 62 percent retracement of the decline from $1815.2. Closing above $1799 would call for a move toward $1820 again.

This is a brief analysis for the next day or so. Our weekly Metals Commentary and daily updates are much more detailed and thorough energy price forecasts that cover key COMEX precious metals futures contracts and LME Non-Ferrous (Base) metals, spot gold, the gold/silver ratio, and gold ETFs. If you are interested in learning more, please sign up for a complimentary four-week trial

Gold Technical Analysis and Near-Term Outlook

Gold is still poised to challenge a major target and bearish decision point at $1759. This is a probable stalling point because it is the smaller than (0.618) target of the primary wave down from $2107.6 and the equal to (1.00) target of the more recent subwave down from $1878.9. However, a move up from $1759 will likely prove to be corrective of the decline. Closing below $1759 will clear the way for an eventual decline to the $1631 equal to (1.00) target of the primary wave down from $2107.6.

Gold - Daily Chart
Gold – Daily Chart

Today’s formation of an inverted hammer dampens near-term odds for a test of $1759 and warns that the move down might stall soon. Again, the most probable stalling point is $1759. Nevertheless, settling above $1791 will confirm the inverted hammer and call for a test of key near-term resistance at $1809. For now, this level is expected to hold, but closing above $1809 will call for a larger test of resistance and possibly a period of consolidation before the decline continues.

This is a brief analysis for the next day or so. Our weekly Metals Commentary and daily updates are much more detailed and thorough energy price forecasts that cover key COMEX precious metals futures contracts and LME Non-Ferrous (Base) metals, spot gold, the gold/silver ratio, and gold ETFs. If you are interested in learning more, please sign up for a complimentary four-week trial.

Gold Technical Analysis and Near-Term Outlook

Gold is poised to decline. Today’s move down formed a bearish engulfing line and broke the neckline of an intra-day complex head and shoulders reversal pattern. Furthermore, the decline took out the $1826 equal to target of the wave down from $1856.6 and the 38 percent retracement of the rise from $1784.6. Gold is now positioned to fall to $1812. This is in line with the larger than (1.618) target of the wave down from $1856.6, the 62 percent retracement of the rise from $1784.6, and the complex head and shoulders’ target. Closing below $1812 might initially prove to be a challenge but will clear the way for the next major objectives at $1776 and $1759.

Gold - $5 Kase Bar Chart with Head and Shoulders Reversal Pattern
Gold – $5 Kase Bar Chart with Head and Shoulders Reversal Pattern

Nevertheless, the move down might still prove to be corrective. This has become doubtful given the combination of bearish technical factors today. However, a close above $1843 will call for the $1848.6 swing high to be overcome. This would invalidate the complex head and shoulders and call for a test of key near-term resistance at $1861. Settling above $1861 would shift near-term odds in favor of challenging $1877, which is now split between the 100- and 200-day moving averages. This level is the last level of resistance before a $1901 bullish decision point.

This is a brief analysis for the next day or so. Our weekly Metals Commentary and daily updates are much more detailed and thorough energy price forecasts that cover key COMEX precious metals futures contracts and LME Non-Ferrous (Base) metals, spot gold, the gold/silver ratio, and gold ETFs. If you are interested in learning more, please sign up for a complimentary four-week trial.

Gold Technical Analysis and Near-Term Outlook

Gold fell as called for after breaking lower out of a flat ascending triangle and took out the $1804.7 swing low. This invalidated the waves up from $1804.7 and has cleared the way for a test of $1779 tomorrow. This is the smaller than (0.618) target of the primary wave down from $1966.8. Therefore, once $1779 is met odds for an eventual decline to this wave’s $1717 equal to (1.00) target will increase to better than even in the coming weeks.

Furthermore, taking out $1779 will call for a move to challenge $1759. This is structurally the most important objective on the chart because it is the smaller than target of the primary wave down from $2107.6. Settling below this will call for a much firmer bearish outlook in the coming weeks and perhaps longer because the equal to target for this wave is $1631.

Gold - $15 Kase Bar Chart
Gold – $15 Kase Bar Chart

With that said, $1779 is currently the most confluent target on the chart. Therefore, from a near-term perspective, once $1779 is met a test of resistance is anticipated. Nevertheless, any move up from $1779 will most likely prove to be corrective of a larger decline and should hold $1817. Key near-term resistance is $1834, a close above which would call for $1856 and possibly higher.

This is a brief analysis for the next day or so. Our weekly Metals Commentary and daily updates are much more detailed and thorough energy price forecasts that cover key COMEX precious metals futures contracts and LME Non-Ferrous (Base) metals, spot gold, the gold/silver ratio, and gold ETFs. If you are interested in learning more, please sign up for a complimentary four-week trial

Gold Technical Analysis and Near-Term Outlook

Gold retains a bearish near-term outlook after falling to the $1834 smaller than (0.618) target of the newly formed primary wave down from $1874.6. There is immediate support at $1829 still. However, barring any random influence from external factors, this wave down from $1874.6 is now poised to reach its $1817 equal to (1.00) target. Closing below $1817 will clear the way for $1802 and lower.

Gold - $15 Kase Bar Chart
Gold – $15 Kase Bar Chart

Nevertheless, the decline from $1874.6 has been quite choppy and might still prove to be corrective of a larger move up from $1800.8. Should gold overcome $1855 look for a test of $1874. This is the smaller than target of the wave up from $1800.8 and the barrier to a more significant test of resistance. Settling above $1874 would clear the way for $1902 and possibly $1926, the higher of which is the gateway to a bullish outlook.

This is a brief analysis for the next day or so. Our weekly Metals Commentary and daily updates are much more detailed and thorough energy price forecasts that cover key COMEX precious metals futures contracts and LME Non-Ferrous (Base) metals, spot gold, the gold/silver ratio, and gold ETFs. If you are interested in learning more, please sign up for a complimentary four-week trial

Gold Technical Analysis and Near-Term Outlook

Gold gained a bit of bullish momentum for the near-term after rising above the $1864 swing high and settling back above the 200-day moving average yesterday. Furthermore, the wave up from $1800.8 fulfilled its $1866 smaller than (0.618) target. This is important because waves that meet the smaller than target generally fulfill their equal to (1.00) target, in this case, $1885. Settling above $1885 will call for a test of the $1905 intermediate (1.382) target, which is also in line with the 62 percent retracement of the decline from $1962.5.

Gold - $15 Kase Bar Chart
Gold – $15 Kase Bar Chart

As stated in yesterday’s analysis, for the larger scale move down to retain a reasonable chance at extending $1905 must hold. Closing above $1905 would imply that gold is adopting a firmer bullish outlook and call for a test of $1922. This is the larger than (1.618) target of the wave up from $1800.8 and the smaller than target of the more important wave up from $1767.2.

Nevertheless, today’s lackluster follow-through after yesterday’s rally formed a daily hanging man. Normally, this type of pattern is most effective at predicting a reversal at the top of a long-term uptrend. Even so, today’s trading suggests the move up might still prove to be a short-lived correction. Falling below $1846 will call for key support at $1829. Closing below $1829 will confirm the hanging man and invalidate the wave up from $1800.8 that makes the connection to $1885 and higher.

This is a brief analysis for the next day or so. Our weekly Metals Commentary and daily updates are much more detailed and thorough energy price forecasts that cover key COMEX precious metals futures contracts and LME Non-Ferrous (Base) metals, spot gold, the gold/silver ratio, and gold ETFs. If you are interested in learning more, please sign up for a complimentary four-week trial.

Gold Technical Analysis and Near-Term Outlook

The longer-term outlook for gold is bearish once again after the pullback from $1962.5 accelerated and took out the smaller than (0.618) target of the wave down from $1973.3 and the 62 percent retracement of the rise from $1767.2. The subsequent move up from $1817.1 has been shallow and choppy and is most likely corrective. Moreover, today’s decline to $1826.6 wiped out most of the intra-day waves that had formed during the move up from $1817.1.

Near-term odds also favor a continued decline. A move below $1835 will call for $1820 and $1808. Settling below $1808 will clear the way for $1789 and lower.

Gold - $15 Kase Bar Chart
Gold – $15 Kase Bar Chart

Nevertheless, the move up from today’s $1826.6 low met the smaller than target of the newly formed primary wave up from $1817.1. Therefore, this wave has a reasonable chance of rising to challenge its $1873 equal to (1.00) target before the decline continues. Rising above $1856 early tomorrow will increase odds for a test of $1873. This is also the 38 percent retracement of the decline from $1962.5 and is expected to hold. Closing above $1873 would call for a larger test of resistance before the decline continues.

This is a brief analysis for the next day or so. Our weekly Metals Commentary and daily updates are much more detailed and thorough energy price forecasts that cover key COMEX precious metals futures contracts and LME Non-Ferrous (Base) metals, spot gold, the gold/silver ratio, and gold ETFs. If you are interested in learning more, please sign up for a complimentary four-week trial

Gold Technical Analysis and Near-Term Outlook

Gold has begun to take on a more positive long-term outlook during the past few weeks. The primary wave up from $1767.2 is still poised to eventually challenge a bullish decision point at $1974. However, the move up stalled at $1962.5, and the subsequent pullback to $1902.6 completed a daily bearish evening star and KaseCD momentum divergence signal. Therefore, the near-term outlook is bearish and a close below the 100-day moving average around $1906 will clear the way for $1891 and possibly $1867 during the next few days. Settling below $1867 is currently doubtful but would call for a bearish decision point at $1838 to be challenged. Closing below this would strongly suggest that the move up has failed and that the larger-scale decline from $2099.2 will continue.

Gold - $10 Kase Bar Chart
Gold – $10 Kase Bar Chart

With that said, trading was quite choppy today and held the 100-day moving average for the second straight day. Should gold overcome $1935, yesterday’s midpoint and the 62 percent retracement of the decline from $1962.5, look for a test of key near-term resistance at $1955. Settling above this would reaffirm a positive near-term outlook and call for a test of the $1974 bullish decision point.

This is a brief analysis for the next day or so. Our weekly Metals Commentary and daily updates are much more detailed and thorough energy price forecasts that cover key COMEX precious metals futures contracts and LME Non-Ferrous (Base) metals, spot gold, the gold/silver ratio, and gold ETFs. If you are interested in learning more, please sign up for a complimentary four-week trial.

Gold Technical Analysis and Near-Term Outlook

Gold challenged crucial resistance around $1894 and settled above the 50-day moving average today. This is quite bullish for the outlook because $1894 is the 62 percent retracement of the decline from $1973.3, the 38 percent retracement from $2099.2, and, most importantly, the smaller than (0.618) target of the primary wave up from $1767.2. Most waves that meet the smaller than target rise to fulfill at least the equal to (1.00) target, in this case, $1930. Consequently, due to the confluence and importance of $1894, a sustained close above this objective would be a firm warning that the move down from $2099.2 might be complete and suggest that a longer-term bullish outlook is being readopted.

Gold - $10 Kase Bar Chart
Gold – $10 Kase Bar Chart

With that said, because $1894.0 held on a closing basis there is a reasonable chance for a corrective pullback to $1872 and possibly $1852 first. Support at $1852 is expected to hold. Closing below this will call for a test of key near-term support at $1833. This threshold is in line with the 50 percent retracement of the rise from $1767.2 and the 200-day moving average. Closing below $1833 would call for a move below the $1820.0 swing low. This would invalidate the wave up from $1767.2 that makes the connection from $1894 to $1930 and higher and confirm that the move up has failed.

This is a brief analysis for the next day or so. Our weekly Metals Commentary and daily updates are much more detailed and thorough energy price forecasts that cover key COMEX precious metals futures contracts and LME Non-Ferrous (Base) metals, spot gold, the gold/silver ratio, and gold ETFs. If you are interested in learning more, please sign up for a complimentary four-week trial

Gold Technical Analysis and Near-Term Outlook

Gold is hovering just above a bearish decision point at $1824. This objective is split between the 200-day moving average, the $1824.8 swing low, the smaller than (0.618) target of the wave down from $1879.8, and the 50 percent retracement of the rise from $1767.2. Settling back below the 200-day moving average would imply that the corrective move up from $1767.2 is complete. Closing below $1807, the confluence point between the equal to (1.00) target of the wave down from $1879.8 and the 62 percent retracement of the rise from $1767.2, will confirm this and clear the way for $1780 and lower.

Gold - $10 Kase Bar Chart
Gold – $10 Kase Bar Chart

Nevertheless, while the $1824.8 swing low holds the initial wave up from $1767.2 that met its smaller than target at $1879.8 will continue to call for its $1910 equal to target to be fulfilled. More importantly, rising to $1910 would overcome key resistance at $1896. This is the 62 percent retracement of the decline from $1973.3, the 38 percent retracement from $2099.2, and the smaller than target of the newly formed primary wave up from $1767.2. Settling above $1896 would suggest the larger scale move down might be complete and would call for gold to push toward targets well above $1910.

This is a brief analysis for the next day or so. Our weekly Metals Commentary and daily updates are much more detailed and thorough energy price forecasts that cover key COMEX precious metals futures contracts and LME Non-Ferrous (Base) metals, spot gold, the gold/silver ratio, and gold ETFs. If you are interested in learning more, please sign up for a complimentary four-week trial.