Natural Gas Forecast: NGX16 Forms Intra-Day Bearish Flag

Natural gas was spurred higher last Thursday after government data showed a smaller than expected build for the week ended October 7. However, the move’s strength and resilience reportedly came as a surprise for many market participants due to mild weather across most of the U.S. The market remains well supplied according to many analysts and rig counts have begun to climb. The natural gas rig count expanded by 11 last week, which is the largest increase since late 2014.

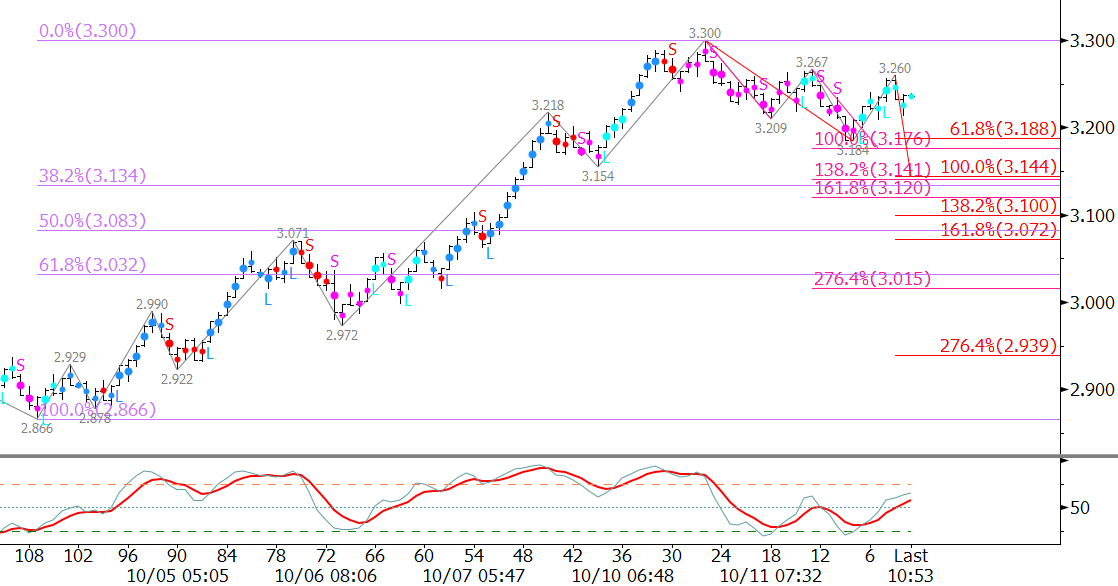
This week, November natural gas prices have fallen to $3.144 so far and settled below major support at $3.21 on Wednesday. The move down stalled just before reaching the next target at $3.12.

The subsequent move up from $3.144 has been shallow, choppy, and is forming a bearish flag. Bearish flags are reasonably reliable patterns that indicate the market should continue to decline. The lower trend line of the flag is $3.15 and the upper trend line is $3.21. The $3.21 level may be tested first but should hold because odds favor a break lower out of the flag.

November 2016 Natural Gas - $0.035 Kase Bar

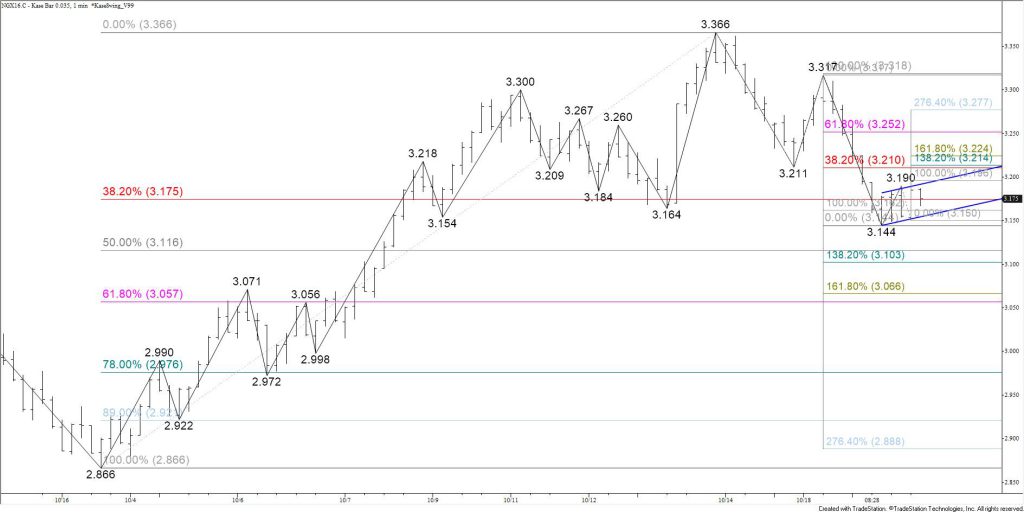
Tomorrow, look for prices to break lower out of the flag and fall to at least $3.12. A close below this would call for $3.06. For the move up to continue in the near-term, $3.06 must hold. This is the 62 percent retracement of the move up from $2.866 to $3.366. A close below $3.06 would shift odds in favor of testing the $2.866 swing low.

Conversely, a break higher out of the flag and close over $3.21 would call for $3.27 and $3.32. A move above $3.32 would take out the wave down from $3.366 that projects to $3.06 and lower.

This is a brief natural gas forecast for the next day or so. Our weekly Natural Gas Commentary and intra-week updates provide a much more detailed and thorough analysis. If you are interested in learning more, please sign up for a complimentary four-week trial.

Last week, after WTI crude oil surged higher on Monday, prices eased a bit and an overdue correction started. Media sources indicate prices fell due to concern about persistent oversupply. Traders are reportedly waiting for new bullish news to push prices higher. In addition, skeptics remain doubtful that OPEC will be able to follow through on last month’s proposed production cut.

Technical factors show that the correction should extend to at least $49.1. This is because the wave $52.16 – 49.79 – 51.51 met its 0.618 projection at $49.9. Waves that meet the 0.618 projection typically extend to the 1.00 projection, in this case $49.2. This is also near the 38 percent retracement of the move up from $43.77. The confluence point is $49.1.

clz6-20161017

That said, the correction may be forming a bullish descending triangle. The upper trend line of the formation is $51.1. The move up late today indicates WTI might test this upper trend line before the downward correction continues.

A close over $51.1 would call for the $51.51 swing high to be overcome. This would, in turn, take out the wave down from $52.16 that projects to $49.0 and lower. Therefore, for the move down to continue as expected $51.1 should hold and the $51.51 swing high must hold.

This is a brief analysis and outlook for the next day or so. Our weekly Crude Oil Commentary and intra-week updates are a much more detailed and thorough energy price forecast. If you are interested in learning more, please sign up for a complimentary four-week trial.

Media sources state that traders and analysts are looking to current warm weather in the south and anticipation of a colder than normal winter as catalysts for higher natural gas prices. However, some reports indicate many traders and analysts remain skeptical and have stated that the move up is too soon in anticipation of real weather. These traders and analysts are concerned that an early move higher may lead to disappointment due to inventories that could exceed record levels by the end of this month.

Natural gas’s move up has been resilient and reflects the market’s desire for a longer-term bullish move. The bullish sentiment was reflected by the move to $3.30 on Monday. However, this was a highly confluent wave projection that has held and November has pulled back to $3.184 so far.

From a technical standpoint, there is little doubt that the move down is corrective. The decline has been shallow and choppy and may form a bullish expanding wedge. However, today’s close below Monday’s midpoint and the waves down from $3.30 call for the correction to extend at least a bit more before the move up continues.

ngx6-20161012

Support at $3.18 is still important. A move below $3.18 would call for at least $3.14, which is a confluent wave projection and retracement level. A close below $3.14 would open the way for a more significant correction before prices rise to a new 2016 high.

Resistance at $3.27 must hold for the correction to extend to $3.14. A move above $3.27 before $3.14 is met would indicate the correction is complete and call for prices to rise to crucial targets above $3.30.

This is a brief natural gas forecast for the next day or so. Our weekly Natural Gas Commentary and intra-week updates provide a much more detailed and thorough analysis. If you are interested in learning more, please sign up for a complimentary four-week trial.

November natural gas has shown signs of strength over the past few days. November held support near $2.90 and on Tuesday completed a daily hammer when prices settled above $2.94. A bullish RSI divergence was confirmed at $2.866 on several intra-day charts. On Wednesday, the move up rallied to a very important $3.05 target ahead of the close. Finally, as of Wednesday, the weekly candlestick forms a bullish engulfing line.

These positive factors indicate the move up should continue to $3.09, $3.12, and possibly $3.18 over the next few days. A move to these targets would also take out the crucial $3.079 swing high. This would significantly dampen the odds for a continued decline to targets below $2.90.

ngx6-20161005

That said, $3.05 is a potential stalling point. This is because $3.05 is the 62 percent retracement of the decline from $3.166 to $2.866 and the 1.00 projection of the wave $2.866 – 2.99 – 2.922. There are no definitive factors that indicate the move will stall at $3.05, but caution is warranted.

Should prices pullback from $3.05, support at $2.98 should hold. The key level for the near-term is $2.94. This is the 62 percent retracement of the move up from $2.866 to $3.058. A close below $2.94 would call for another test of the $2.866 swing low and most likely signal that a trading range is forming.

This is a brief natural gas forecast for the next day or so. Our weekly Natural Gas Commentary and intra-week updates provide a much more detailed and thorough analysis. If you are interested in learning more, please sign up for a complimentary four-week trial.

According to some pundits, natural gas’s recent move up is due to improved balancing of supply and demand. Government data shows the degree to which inventories are up this year relative to the five-year average has continued to shrink. It has been a hot summer, and demand has remained relatively strong.

That said, production has done well to keep pace with demand during summer, and there is a limit to the amount of gas that can be stored. Many analysts project that injection season will end at or near record levels again this year. Therefore, the market should be well supplied ahead of winter.

Fundamental factors will rule the longer-term. However, there are still many questions that need to be answered over the next six to eight weeks before the market can realistically determine a longer-term direction. For the near-term, a trading range between nominally $2.55 and $2.95 is still the most logical conclusion for now. Keep in mind, for nearly nine months of 2015 the prompt month futures contract traded in this range.

From a technical standpoint, October natural gas was poised to rise to $3.04 after overcoming resistance at $2.86 the $2.947 swing high late last week. The pullback from $2.949 is likely corrective and stalled near $2.81 on Wednesday. This is the 38 percent retracement of the move up from $2.58 and the 1.618 projection of the wave down from $2.949.

NGV6 20160831

If the move up is going to extend to new highs in the near term, $2.81 needs to hold. In addition, October will need to finally close over $2.95. Otherwise, a close below $2.81 would signal trading range and call for confluent support at $2.71 to be challenged.

This is a brief natural gas forecast for the next day or so. Our weekly Natural Gas Commentary and intraweek updates provide a much more detailed and thorough analysis. If you are interested in learning more, please sign up for a complimentary four-week trial.

On Friday, WTI crude oil prices pulled back sharply after the U.S. Federal Reserve signaled short-term interest rates may be raised in coming weeks. The U.S. dollar rose, and oil prices fell. The week ended on a negative note, and the corrective pullback extended again on Monday.

Aside from the stronger dollar, media outlets also indicate traders and analysts are weighing the potential consequences of a still oversupplied market against the prospects of a production freeze. Last week, DOE data showed U.S. inventories of oil and refined products have risen to a record high. However, Iran has reportedly shown interest in joining talks with other major producers regarding measures to freeze production in a unified effort to stabilize prices.

The longer-term technical outlook for oil remains positive. However, near-term factors indicate the corrective decline should continue to extend first. October WTI met the 0.618 projection of the wave $49.36 – 46.42 – 48.46 on Monday. Nearly 80 percent of waves that meet the 0.618 projection extend to the 1.00 projection. Therefore, odds favor $45.5 before the move up continues.

CLV6 20160829

The $45.5 target is important because it is near the 38 percent retracement of the move up from $39.96 to $49.36. A “normal” correction should hold $45.5. A close below $45.5 would open the way for an extended correction and potential trading range in the mid-to-upper $40s.

The move down will remain choppy, but over the next few days look for resistance at $47.9 to hold. Key resistance is $48.7. A move to $48.7 would take out the wave down from $49.36 that projects to $45.5 and lower.

This is a brief analysis and outlook for the next day or so. Our weekly Crude Oil Commentary and intraweek updates are a much more detailed and thorough energy price forecast. If you are interested in learning more, please sign up for a complimentary four-week trial.

Late last week, September natural gas fulfilled important support near $2.51 when prices fell to $2.523. This is the 1.00 projection of the wave down from $2.99, the 50 percent retracement of the move up from $2.009, and the 62 percent retracement from $2.195. The confluence of targets around $2.51 indicate it is a potential turning point for natural gas.

Prices have risen from $2.523 to $2.648 so far, but the move has been extremely choppy and shallow. As a result, the move is most likely corrective. This is accentuated by the formation of a bearish pennant on the intra-day charts. Pennants are continuation patterns that indicate the prior trend should continue. In this case, the pennant favors a break lower. A close below $2.57 would confirm the break lower out of the pennant and open the way for another test of key support at $2.51.

NGU6 20160817

September natural gas has worked its way to important resistance at $2.64, but has not been able to close over this level yet. $2.64 is the 0.618 projection of the primary wave up from $2.523. A close over $2.64 would call for key resistance at $2.68. The $2.68 level is near the 38 percent retracement of the move down from $2.911 and is the midpoint of last Tuesday’s candlestick. A close over $2.68 would be a strong indication that prices will settle back into a trading range.

It is a tight call right now, but until there is a close over $2.68, odds favor a continued decline.

This is a brief natural gas forecast for the next day or so. Our weekly Natural Gas Commentary and intraweek updates provide a much more detailed and thorough analysis. If you are interested in learning more, please sign up for a complimentary four-week trial.

September WTI crude oil’s settle above $44.4 Friday and $45.7 Monday has opened the way for the move up to continue. The Stochastic has risen into overbought territory, but there is no technical evidence the move will stall.

The next targets are $46.3, $47.0, and $47.9. The $47.9 level is a crucial confluence point split between the 62 percent retracement of the decline from $52.73 and the 1.618 projection of the wave up from $39.19. A sustained close over $47.9 would confirm the market is moving toward bullish territory again.

CLU6 20160815

A pullback may take place soon. However, support at $45.3 should hold. This is near Monday’s midpoint. Key support for the near-term is $44.7. A close below this would call for an extended downward correction to at least $44.1 and possibly $43.5.

This is a brief analysis and outlook for the next day or so. Our weekly Crude Oil Commentary and intraweek updates are a much more detailed and thorough energy price forecast. If you are interested in learning more, please sign up for a complimentary four-week trial.

September natural gas’s correction down from $2.99 is extending after breaking lower out of a coil formation. Tuesday’s close below $2.66, the 0.618 projection of the wave $2.99 – 2.591 – 2.911, opened the way for the 1.00 projection at $2.51. The $2.51 target is also the 50 percent retracement of the move up from $2.009 to $2.99 and the 62 percent retracement from $2.195. Unless there is a bearish shift in underlying fundamentals, $2.51 should hold.

NGU6 20160803

The KaseCD, a second derivative momentum indicator, is setup for bullish divergence on the daily chart. First resistance is $2.63. The key level for the near-term is $2.68. This is Tuesday’s midpoint and the 38 percent retracement of the decline from $2.911. A close over $2.68 would indicate September natural gas will most likely settle back into the recent trading range.

This is a brief natural gas forecast for the next day or so. Our weekly Natural Gas Commentary and intraweek updates provide a much more detailed and thorough analysis. If you are interested in learning more, please sign up for a complimentary four-week trial.

September WTI crude oil’s correction up from $39.19 gained ground on Monday when it settled above $42.8. Media outlets indicate the rise was due renewed hopes that OPEC members might consider freezing production levels. OPEC announced on Monday that they would hold informal talks at an energy conference in September.

That said, from a technical perspective, the move down was due for a correction. September WTI briefly moved into bearish territory last week when it settled below $40.4. However, a highly confluent and important $39.2 target held when the $39.19 swing low was made. The Stochastic has since risen out of oversold territory, and several intraday charts confirmed bullish momentum divergences.

CLU6 20160808

Friday’s hanging man candlestick pattern was negative by Monday’s close over $42.8. This opens the way for $44.4. This is the 38 percent retracement of the decline from $52.73 to $39.19 and an important decision point for the near-term. If the move down is going to continue within the next few weeks, $44.4 should hold. However, a close over $44.4 would call for an extended correction and could be an early indication that another long-term bottom has been made.

As the move up extends over the next few days, look for near-term support at $42.5, $41.8, and $40.8. The $42.5 level will probably be tested early Tuesday, but should hold. This is near Monday’s midpoint. Key support is $40.8 because it is the 62 percent retracement of the move up from $39.19. A close below this would shift odds in favor of testing $39.19 again.

This is a brief analysis and outlook for the next day or so. Our weekly Crude Oil Commentary and intraweek updates are a much more detailed and thorough energy price forecast. If you are interested in learning more, please sign up for a complimentary four-week trial.