Crude Oil Forecast: July WTI Poised for $52.5

WTI crude oil continues to rise ahead of May 25’s OPEC meeting. Market participants are optimistic that OPEC will extend production cuts through the end of 2017. Many hope this will help to ease the global supply glut. U.S. production remains a concern, but for now, oil prices are poised to rise.

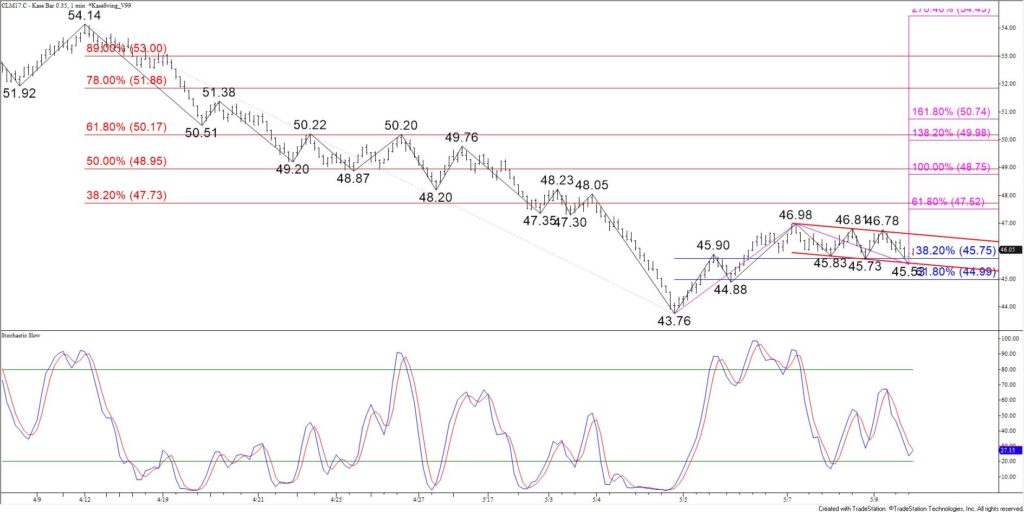
Most technical factors are positive. In recent days, July WTI sustained settles above the 62 percent retracement of the decline from $54.45 to $44.13. This is a strong indication that the recovery from $44.13 will continue.

July 2017 WTI Crude Oil - 35-Cent Kase Bar Chart
July 2017 WTI – 35-Cent Kase Bar Chart

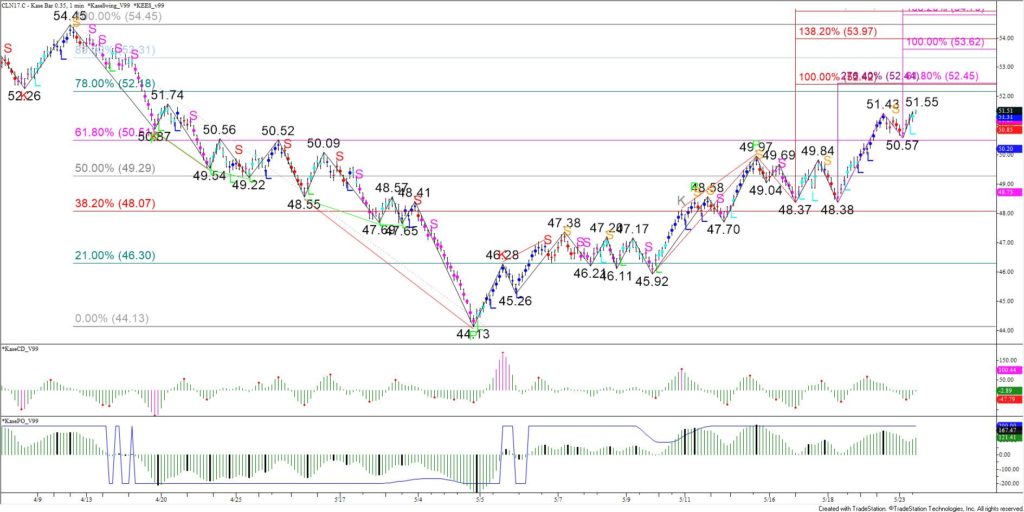
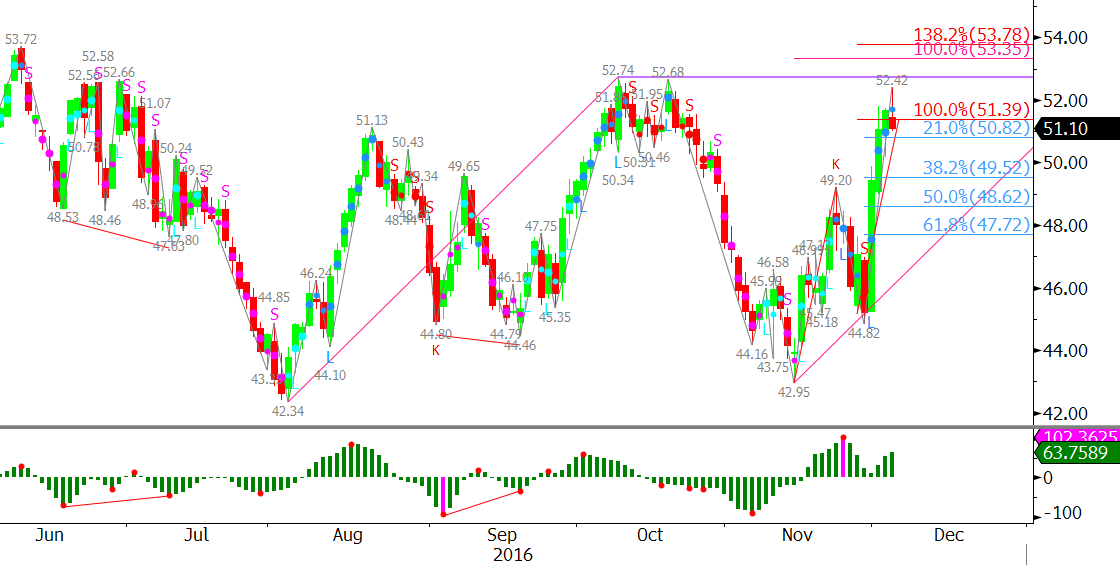
Today’s break higher out of another intraday bullish flag and settle above Monday’s $51.43 high opens the way for $52.5. As shown in the chart above, this is a highly confluent wave projection that sits just above the 78 percent retracement of the decline from $54.45 to $44.13. The confluence of wave projections at $52.5 make it a potential stalling point.

Momentum on the KaseCD and KasePO is rising. The KasePO is setup for bearish momentum divergence, a reversal signal that forms when higher swing highs in price and lower swing highs in momentum are made. To confirm the divergence signal, a swing high in price and momentum must form before momentum rises to a new high.

The Kase Easy Entry System (KEES) also triggered a second class buy signal (light blue L) on the 35-cent Kase Bar chart today. A second-class buy signal indicates the majority of momentum indicators KEES examines are positive but that momentum on the synthetic longer bar length is negative. Traders using Kase StatWare may have taken a smaller position and placed a tighter trailing stop. Stops may be widened once the KEES permissions shift to first class (dark blue dots).

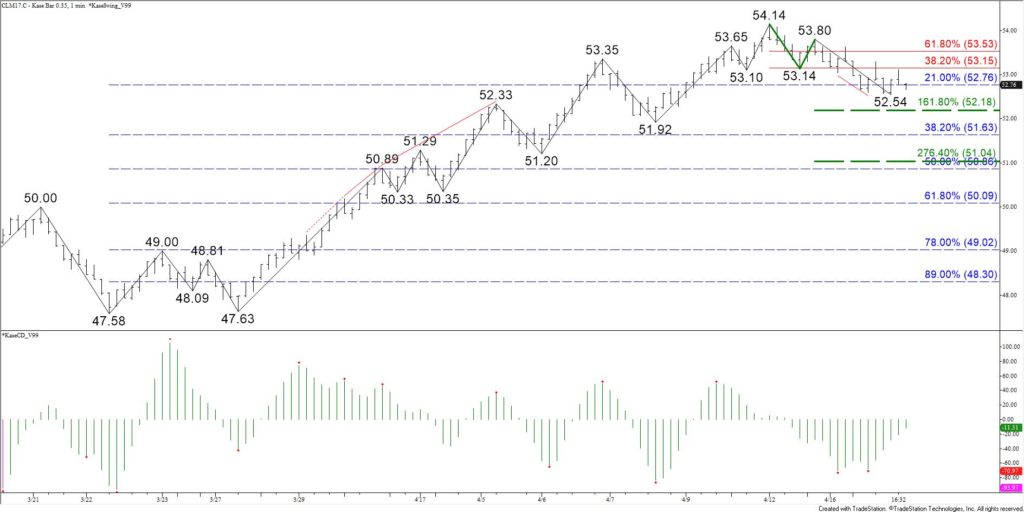
For the near-term, the $50.57 swing low is important support. A move below this would likely trigger the bearish KasePO divergence and open the way for a correction to $50.0 and possibly $49.6.

This is a brief analysis and outlook for the next day or so. Our weekly Crude Oil Commentary and daily updates are much more detailed and thorough energy price forecasts that cover WTI, Brent, RBOB Gasoline, Diesel, and spreads. If you are interested in learning more, please sign up for a complimentary four-week trial.

The long-term outlook for WTI crude oil remains negative and it is too soon to state that a bottom has been made. However, last Friday, June WTI met major support at $43.76, the 1.00 projection of the wave $57.95 – 47.58 – 54.14 (exact projection was $43.77). This was also in the realm of the August 2016 swing low of $44.56 and the 62 percent retracement of the move up from $36.18 to $57.95 ($44.5). The confluence of support between $43.77 and $44.56 and the fact that this range has held on a closing basis favors a larger upward correction before the decline continues.

In addition to meeting support at $43.76, June WTI confirmed daily bullish divergences on the KaseCD and Stochastic and a bullish KasePO PeakOut (oversold signal). These signals call for the upward correction to extend. Most importantly, over the past two days, the pullback from $46.98 formed a bullish intraday flag, shown below on the $0.35 Kase Bar chart.

June 2017 WTI Crude Oil - $0.35 Kase Bar Chart
June 2017 WTI Crude Oil – $0.35 Kase Bar Chart

For now, according to Kase’s price forecasting model, odds are 65 percent for a break higher out of the flag. These odds will increase as prices rise toward the upper trendline of the flag at $46.6.

Important resistance at $47.6 should be challenged upon a break higher out of the flag. This is the confluence point between the 38 percent retracement of the decline from $54.14 to $43.76 and the 0.618 projection of the wave $43.76 – 46.98 – 45.53.

That said, there are some danger signs that indicate the flag, and other bullish technical factors, are on the teetering edge of failing.

The key to a break higher out of the flag and extended upward correction is holding support at $45.5. This is in line with the today’s $45.53 swing low and the flag’s lower trendline. A close below this would call for a test of $45.0, the 62 percent retracement of the move up from $43.76 to $46.98. Settling below $45.0 would shift near-term odds back in favor of testing the $43.76 low again.

This is a brief analysis and outlook for the next day or so. Our weekly Crude Oil Commentary and intra-week updates are much more detailed and thorough energy price forecasts that cover WTI, Brent, RBOB Gasoline, Diesel, and spreads. If you are interested in learning more, please sign up for a complimentary four-week trial.

On Tuesday, crude oil prices continued to slip lower. Technical factors indicate June WTI’s corrective decline from $54.14 is poised to extend to at least $52.2. This is the 1.618 projection of the wave $54.14 – 53.14 – 53.8 and the 50-day moving average. A close below $52.2 would call for key near-term support at $51.6. This target is crucial because it’s the 38 percent retracement of the move from $47.58 to $54.14 and the 200-day moving average.

June 2017 WTI Crude Oil - $0.35 Kase Bar Chart
June 2017 WTI Crude Oil – $0.35 Kase Bar Chart

That said, a bullish KaseCD divergence on the $0.35 Kase Bar chart indicates another test of $52.2 and possibly $53.6 might take place first. Resistance at $53.6 is expected to hold. A close over this would call for $54.3. However, a sustained close over $54.0 is the key to a continued rise. This is the 62 percent retracement of the decline from $57.95 to $47.58.

This is a brief analysis and outlook for the next day or so. Our weekly Crude Oil Commentary and intra-week updates are much more detailed and thorough energy price forecasts that cover WTI, Brent, RBOB Gasoline, Diesel, and spreads. If you are interested in learning more, please sign up for a complimentary four-week trial.

As of December 9, natural gas had risen for the fourth straight week to the highest level in two years. Reports indicate the surge was due to colder than average temperatures in recent weeks. However, on December 12, January natural gas gapped down after the move up stalled at $3.777. The gap may be an early indication the move up is exhausted, though we doubt this is the case.

From a technical and fundamental standpoint, it is much too early to definitively state that the move up is over. Forecasts for persistent cold in coming weeks will most likely continue to support prices and the larger scale wave formations for January, February, and March all call for prices to ultimately rise to at least $3.90.

That said, this does not mean that corrections will not take place. Monday’s gap down was most likely the market coming back to reality a bit. The move up has been hard and fast, and if it is going to be sustained for the longer-term, corrections are necessary.

Since gapping down on Monday, prices have slowly inched lower, indicating the decline is most likely corrective. So far, support at $3.47 has held on a closing basis. However, near-term odds favor at least $3.41. This is the 0.618 projection of the primary wave down from $3.777. A close below $3.41 would open the way for confluent support at $3.36 and then $3.30. Unless there is a bearish shift in underlying factors, we expect $3.30 to hold.

January Natural Gas - $0.035 Kase Bar Chart

Initial resistance is $3.57. If prices are going to fall below $3.41, $3.57 will most likely hold. The most important resistance is $3.66. This is the top of Monday’s gap and near the 62 percent retracement of the decline from $3.777. A close over $3.66 would be a strong indication that the downward correction is complete and that the move up is going to continue its way toward $3.90.

This is a brief natural gas forecast for the next day or so (in this case, a bit longer). Our weekly Natural Gas Commentary and intra-week updates provide a much more detailed and thorough analysis. If you are interested in learning more, please sign up for a complimentary four-week trial.

Early Monday, crude oil prices were bolstered again after an announcement made by non-OPEC producers to cut 558,000 barrels per day. This comes after a commitment by OPEC to cut 1.2 million barrels per day. Reports indicate that such cuts will help to rebalance supply and demand by the first half of 2017. However, many market insiders remain skeptical that OPEC and other major producers such as Russia will stick to their agreements and quotas in coming months.

From a technical standpoint, January WTI gapped higher on Monday and met the 0.618 projection of the wave $34.55 – 53.72 – 42.43 at $54.51. This is an extremely important target. Waves that meet the 0.618 projection generally extend to their 1.00 projection, in this case, $61.6. It would likely take weeks, if not months, to reach $61.6. However, upon a sustained close over $54.5, the outlook for WTI would become much more bullish.

WTI Crude Oil

Due to the importance of $54.5, a correction is expected before prices rise much higher. So far, prices have fallen to $52.18 and formed a shooting star pattern on the daily chart. This is negative for the near-term and indicates the gap from $51.66 will most likely be filled within the next day or so.

A close below $51.66 would call for $50.1. This was resilient support last week and is the midpoint of December 1. For now, it looks as though prices will try and hold above $50.1 and will likely settle into a trading range between $50.1 and $54.5.

A close below $50.1 would open the way for $48.7 and $47.4. The lower of these two targets is most important support because it is the 62 percent retracement of the move up from $42.95 to $54.51. A sustained close below $47.4 is doubtful in the near-term but would be a strong indication that the move up is over.

This is a brief analysis and outlook for the next day or so. Our weekly Crude Oil Commentary and intra-week updates are a much more detailed and thorough energy price forecast. If you are interested in learning more, please sign up for a complimentary four-week trial.

Crude Oil rose substantially last week after OPEC agreed to cut output by 1.2 million barrels per day. The week posted the largest percentage gain since 2009 and many market participants reportedly expect the move up to continue.

However, others remain skeptical that OPEC members will comply with production quotas. Members have been known to cheat quotas in the past per media sources. In addition, pundits say higher prices would likely encourage more shale production in the U.S., which would ultimately offset OPEC cuts.

Most long-term technical factors are positive. However, WTI is starting to show signs of weakness for the near-term. January WTI’s move up stalled at $52.42 before prices could overcome the mid-October double top at $52.7. To reach the next target at $53.6 soon, January must overcome $52.7 early this week.

WTI Crude Oil

That said, the KaseCD momentum indicator is set up for bearish divergence and several momentum indicators confirmed bearish divergences on intra-day charts. Therefore, the correction from $52.42 will most likely extend to last Thursday’s $50.1 midpoint first. A close below $50.1 would then call for $49.5, which is the 38 percent retracement of the move up from $44.82 to $52.42.

Key support for the near-term is $49.1. A close below this would be a strong indication that without more help from external factors, the move up is over, for now.

This is a brief analysis and outlook for the next day or so. Our weekly Crude Oil Commentary and intra-week updates are a much more detailed and thorough energy price forecast. If you are interested in learning more, please sign up for a complimentary four-week trial.

Natural gas’s recovery from recent lows is reportedly due to forecasts for cooler temperatures that could bring more demand in coming weeks. In addition, prices were bolstered on Wednesday due to a surprise two Bcf withdrawal reported in the EIA Natural Gas Storage Report. However, some analysts have cited record storage levels could still ultimately be bearish for the longer-term.

On Monday, December natural gas formed a potential bullish breakaway gap from $2.852. Bullish breakaway gaps occur when a move down becomes exhausted and prices break higher out of a recent trading range. This is a reversal pattern that could indicate the move down is over, for now.

December Natural Gas

In addition, the 200-day moving average was overcome on Wednesday when December settled at $3.026. This is also bullish and indicates, at a minimum, that an extended upward correction to challenge recent swing highs is likely underway.

The wave formation up from $2.546 met important resistance at $3.062 on Wednesday. A small correction might take place first, but the wave formations are poised for $3.17. This is key resistance because it is in line with the $3.163 swing high, which is also crucial on the continuation chart. It is also the 62 percent retracement of the decline from $3.556 to $2.546. A move above $3.17 ($3.31 for January) is doubtful without help from external factors (i.e. cold weather) but would open the way for new 2016 highs.

That said, December may still try to fill the gap from $2.852. Look for initial support at $2.95 and key support at $2.85. The $2.85 level is not only in line with the gap, but also the 38 percent retracement of the move up from $2.546.

This is a brief natural gas forecast for the next day or so. Our weekly Natural Gas Commentary and intra-week updates provide a much more detailed and thorough analysis. If you are interested in learning more, please sign up for a complimentary four-week trial.

The rise in crude oil prices last week was reportedly due to increased hopes that major producers will reach an agreement to cut production. However, others’ skepticism about such a cut, the surging U.S. dollar, and a surprisingly large increase in U.S. oil supplies are said to have kept a lid on the move up so far.

On Monday, January WTI settled above the 50 percent retracement of the decline from $52.74 to $42.95 and the 0.618 projection of the wave $42.95 – 47.12 – 45.18. January also settled above the midpoint of the week ended November 4. In addition, KaseX, which uses a combination of Kase StatWare signals, triggered a buy signal (green triangle).

January WTI Crude Oil

The move up is now in position to challenge key resistance at $49.1. This confluence point is near the 62 percent retracement of the decline and the 1.00 projection of the wave up from $42.95. It is also just above the open for the week ended November 4.

The confluence and importance of resistance around $49.1 make it a potential stalling point. However, a sustained close over $49.1 would indicate a more substantial correction and potential recovery to challenge recent highs is underway.

Initial support is near Monday’s $47.5 midpoint and the 21 percent retracement of the move up from $42.95. This level should hold. Key support for the next few days will be $46.5. This is near Monday’s open and the 38 percent retracement. A close below $46.5 would indicate the corrective move up is over and that another test of major support is about to take place.

This is a brief analysis and outlook for the next day or so. Our weekly Crude Oil Commentary and intra-week updates are a much more detailed and thorough energy price forecast. If you are interested in learning more, please sign up for a complimentary four-week trial.

Crude oil prices continue to decline. Reports indicate the primary culprit is waning expectations for a meaningful OPEC output cut. In addition, some see record level production from countries like Russia and Canada as an equalizer to any cuts that may be made. There is also added uncertainty as US president-elect Donald Trump has pledged to loosen US drilling restrictions, which could boost domestic output next year.

Most technical factors are also negative. December WTI crude oil is poised to challenge the $41.58 swing low made August 3. This is in line with the 62 percent retracement of the move up from $34.06 to $53.62. Key support is $40.0, the 1.00 projection of the wave $53.62 – 41.58 – 52.22. A close below $41.6 would call for a long-term bearish outlook. A close below $40.0 would open the way for potentially $35.6 and lower.

crude oil daily candlesticks

That said, on Monday the move down stalled at $42.2 and formed a bullish hammer. This is a reversal pattern setup that indicates the upward correction may extend first. The hammer’s completion point is $43.9 and the confirmation point is $44.4.

A close over $44.4 would call for a more substantial correction to $46.0. This is crucial resistance for the near-term because it is the 38 percent retracement of the decline from $52.22 to $42.2. Without a bullish shift in underlying factors, it is doubtful that $46.0 will be overcome.

This is a brief analysis and outlook for the next day or so (in this case, a bit longer). Our weekly Crude Oil Commentary and intra-week updates are a much more detailed and thorough energy price forecast. If you are interested in learning more, please sign up for a complimentary four-week trial.

Natural gas has fallen hard ahead of November’s expiration. Speculation that natural gas storage could reach record levels ahead of winter and warmer than normal weather forecasts for the next few weeks are reportedly reasons for falling prices.

Prompt month November futures fell to $2.627 on Wednesday where the 62 percent retracement of the move up from $2.168 to $3.366 was met. Prices rallied into the close and November settled at $2.731. This setup a daily morning star and hammer, which indicates prices may rise to $2.82 and even $2.88 before November expires on Thursday.

The negative outlook has also spilled over into the December contract, which fell below the crucial $3.01 swing low on Wednesday. This was negative because the move below $3.01 takes out what had been December’s primary up wave, $2.37 – 3.368 – 3.01. This significantly dampens the odds for a near-term recovery and a move to new highs.

December natural gas chart

The outlook is negative and there are no definitive technical factors that indicate the move down is over. However, the daily chart is oversold on the KaseCD and setup for a KCDpeak (bullish turn signal). In addition, the 200-day moving average at $2.99 held on a closing basis. These factors and the rally from $2.972 to $3.083 indicate an upward correction to at least $3.13 should take place Thursday. From that point, the move down may continue, or at least test $2.99 again. A close over $3.13 would call for a larger correction to $3.20 and possibly $3.26. This would also indicate a trading range is likely on the horizon.

The 200-day average at $2.99 will be December’s crucial support on Thursday. A close below this would solidify the negative outlook and open the way for $2.93 and lower. Below $2.99, the next major target is $2.82. This is the 62 percent retracement from $2.37 to $3.556.

This is a brief natural gas forecast for the next day or so. Our weekly Natural Gas Commentary and intra-week updates provide a much more detailed and thorough analysis. If you are interested in learning more, please sign up for a complimentary four-week trial.