Crude Oil Forecast: WTI Challenges 62% Retracement

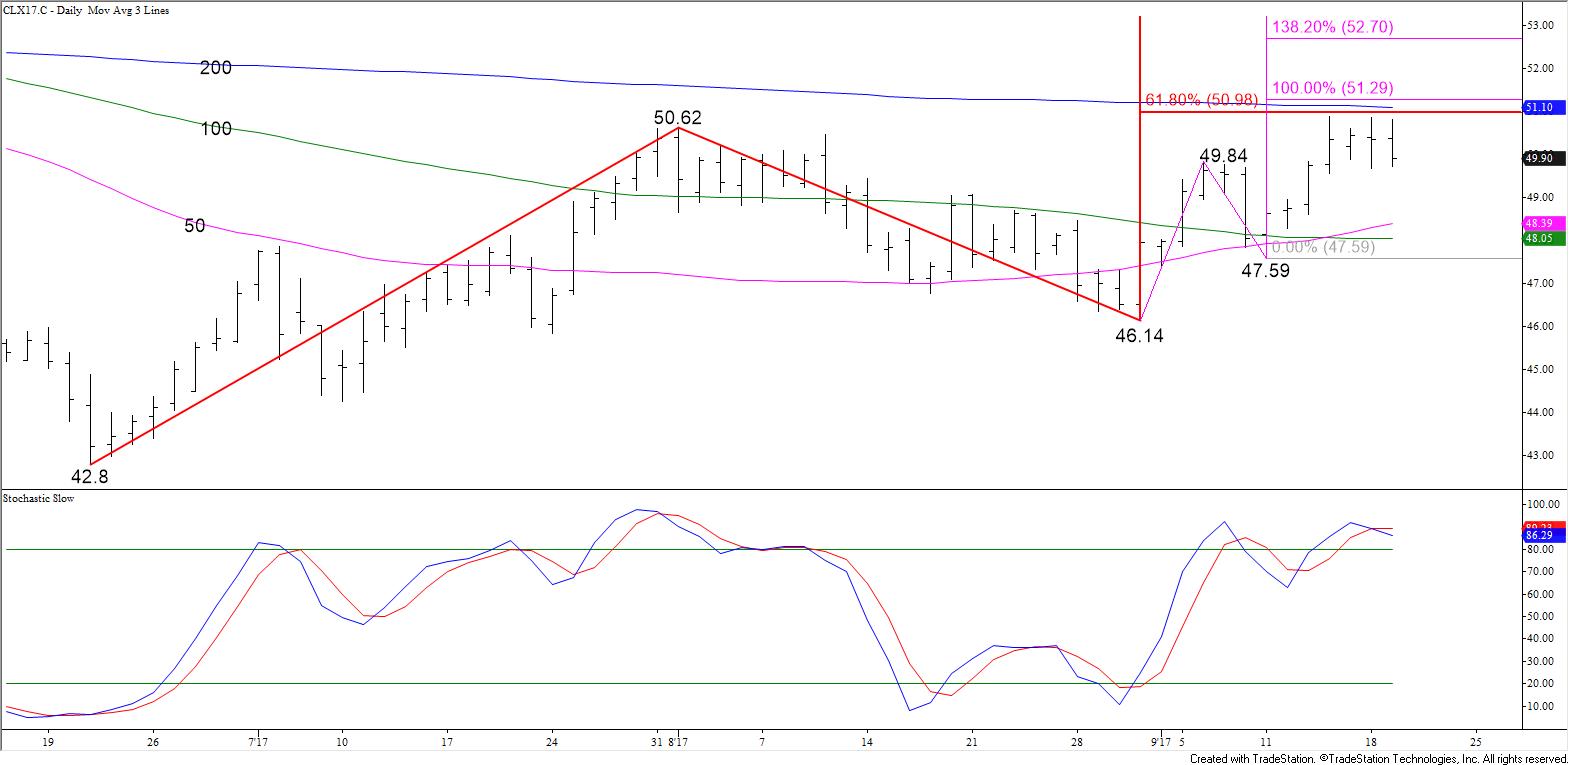
November WTI crude oil met the 62 percent retracement of November’s decline from the 2017 $58.37 swing high to $42.8 at $52.42 when it rose to $52.43 early this morning. This is major resistance because it is also a confluent wave projection. Settling above $52.6, the upper end of the confluence range around $52.42, would be bullish for the long-term.

Crude Oil Daily Candlesticks

For now, the long-term outlook remains positive. However, normally, when such an important target is met a significant correction will take place before that objective is overcome on a sustained closing basis. Today’s pullback from $52.42 formed a bearish Harami line and star, which is a reversal pattern. These patterns are not highly reliable, but the overbought daily Stochastic, RSI and nearly overbought KasePO indicate a pullback should take place soon.

This afternoon’s move up after the API Petroleum Inventories report was released indicates $52.6 might be tested early tomorrow. However, we expect this level to hold and for the downward correction to extend to at least $51.4 tomorrow, which is in line with Monday’s $51.45 midpoint. A close below this would open the way for $51.0 and possibly lower.

At this point, even a normal correction of the move up from the $46.14 swing low could drop prices to $50.0 should the corrective pullback extend as expected.

This is a brief analysis for the next day or so. Our weekly Crude Oil Commentary and daily updates are much more detailed and thorough energy price forecasts that cover WTI, Brent, RBOB Gasoline, Diesel, and spreads. If you are interested in learning more, please sign up for a complimentary four-week trial.

October natural gas’ settle below Monday’s $3.098 midpoint opens the way for a larger correction to at least $3.06. The move down is most likely corrective. However, for the move up to continue over the next few days $3.06 needs to hold. A close below this would not doom the move up but rather indicate that a deeper test of support and possible consolidation will begin to take place.

Natural Gas Wave Projections

Initial resistance is $3.13, the 62 percent retracement of the decline from $3.166, so far. $3.17 is the key threshold for the near-term. A close above this would indicate the corrective pullback is over and that the move up will extend to $3.23. This is currently the most confluent objective making it another potential stalling point.

This is a brief analysis for the next day or so. Our weekly Natural Gas Commentary and daily updates are much more detailed and thorough energy price forecasts that cover key natural gas futures contracts, calendar spreads, the UNG ETF, and several electricity contracts. If you are interested in learning more, please sign up for a complimentary four-week trial.

WTI crude oil has formed strong resistance between $50.82 and $50.88. This level has been challenged three times over the past few days and held. One might argue that this is a triple top. However, the decline from $50.88 has been extremely shallow and choppy indicating it is most likely corrective.

This afternoon’s move up from the $49.73 swing low calls for another attempt at $50.9 early tomorrow. A move above this would call for $51.3, a confluent wave projection that sits just above the 200-day moving average. The confluence and importance of $51.3 make it another potential stalling point. A close over $51.3 would call for $51.7 and $52.5.

Crude Oil Daily Wave Projections

That said, the daily Stochastic is overbought and the move up seems to be exhausted. Should prices fall below $49.6 before rising above $50.9, look for an extended correction to $48.9 and possibly lower before the move up continues to $51.3.

This is a brief analysis for the next day or so. Our weekly Crude Oil Commentary and daily updates are much more detailed and thorough energy price forecasts that cover WTI, Brent, RBOB Gasoline, Diesel, and spreads. If you are interested in learning more, please sign up for a complimentary four-week trial.

October natural gas settled above $3.03 and fulfilled the $3.06 target. The next objective is $3.09, the equal to (1.00) target of the wave $2.88 – 3.088 – 2.885. The key objective is $3.12, the smaller than (0.618) target of the wave $2.799 – 3.042 – 2.88. This has been strong resistance all summer for October and the continuation chart, making it a decision point for a larger scale move up and sustained recovery.

Natural Gas Daily Chart

A sustained close above $3.12 would open the way for $3.17 and $3.22. Above $3.12 the $3.22 objective is most important because it is the 50 percent retracement of the decline from $3.619. This is also a confluent projection for the aforementioned waves up from $2.799 and $2.88.

Daily momentum does not show any signs that the move up will stall. However, a few intraday charts are setup for divergence or are overbought. Therefore, given $3.12 has been such strong resistance a pullback might take place before it is overcome.

At this point, any move down will most likely be corrective. Tomorrow, support at $3.03 should hold. Key support is $2.96, which is the 50-day moving average and 62 percent retracement of the move up from $2.88 so far.

This is a brief analysis for the next day or so. Our weekly Natural Gas Commentary and daily updates are much more detailed and thorough energy price forecasts that cover key natural gas futures contracts, calendar spreads, the UNG ETF, and several electricity contracts. If you are interested in learning more, please sign up for a complimentary four-week trial.

WTI crude oil still looks weaker than Brent and products after forming a star today and settling below Friday’s $48.28 midpoint. However, prices are poised to break higher out of a bullish ascending triangle and should meet the smaller than (0.618) target of the wave $47.0 – 48.44 – 47.84 at $48.7. A close above this would clear the way for the equal to (1.00) target at $49.3. This is an important objective because it is also in line with the smaller than target of the wave $45.58 – 49.42 – 47.0.

October 2017 WTI Crude Oil Kase Bar Chart

There is an outside chance the formation that makes up the ascending wedge is alternatively a double top at $48.44. To confirm the pattern prices would have to hold $48.44 and settle below the $47.84 swing low. This would then call for a test of the double top’s $47.2 target. Settling below $47.2 would call for the decline to extend to $46.8 and $46.4. The $46.4 level is most important because it is the smaller than target of the larger scale wave $50.51 – 45.58 – 49.42.

This is a brief analysis for the next day or so. Our weekly Crude Oil Commentary and daily updates are much more detailed and thorough energy price forecasts that cover WTI, Brent, RBOB Gasoline, Diesel, and spreads. If you are interested in learning more, please sign up for a complimentary four-week trial.

Yesterday’s decline was a dose of reality that has set natural gas back into a state of uncertainty. With all factors considered, October natural gas will most likely settle back into a neutral trading range between nominally $2.91 and $3.04. This is about the same range prices oscillated within before last Thursday’s break high out of the bullish flag.

Natural Gas Kase Bar Chart

The wave formation down from $3.088 and a bearish daily KaseCD divergence call for $2.95, which then connects to $2.91. A close below $2.91 would call for $2.85, which in turn, would take out the crucial $2.88 swing low. A move below $2.88 would wipe out the wave up from $2.799 that projects to key upper resistance at $3.12.

That said, the 50-day moving average has held, so there is a modest chance the wave up from today’s $2.96 low could extend to $3.04 first. At this point we expect $3.04 to hold. However, a close above this would call for another attempt at $3.09 and possibly $3.12.

This is a brief analysis for the next day or so. Our weekly Natural Gas Commentary and daily updates are much more detailed and thorough energy price forecasts that cover key natural gas futures contracts, calendar spreads, the UNG ETF, and several electricity contracts. If you are interested in learning more, please sign up for a complimentary four-week trial.

October WTI crude oil could not settle above $49.2 resistance and is exhibiting signs of exhaustion. A pullback should take place soon, but at this point, there are no definitive technical factors that indicate the move up will stall before reaching $49.6 and possibly $50.0. A close over $50.0 would open the way for another test of $50.5, which then connects to $51.1 and higher.

Crude Oil Daily Candlesticks

Initial support is $48.6. A close below this would call for a larger downward correction to $48.0 and $47.4. Support at $48.0 is the 100-day moving average and the 38 percent retracement of the move up from $45.58. A normal correction should hold $48.0. Support at $47.4 is in line with the 50-day moving average and the 62 percent retracement of the move up from $45.58. Settling below $47.4 would be a strong indication the move up is over.

This is a brief analysis for the next day or so. Our weekly Crude Oil Commentary and daily updates are much more detailed and thorough energy price forecasts that cover WTI, Brent, RBOB Gasoline, Diesel, and spreads. If you are interested in learning more, please sign up for a complimentary four-week trial.

October natural gas looks to be well balanced as it continues to oscillate in a range between nominally $2.88 and $3.03. The range forms a bullish flag after holding support at $2.88 on Monday. However, today’s early move up stalled before it could overcome the $2.998 swing high and challenge the flag’s $3.03 upper trend line.

Flags are generally reliable continuation patterns. However, in this case, we believe there is a high probability that $3.03 will hold and that ultimately prices will break lower out of the pattern. This is because the pattern has been very wide relative to the prior move up from $2.799 to $3.042. In addition, prices have not been able to overcome the psychologically important $3.00 level for the past few days.

NGV17 Kase Bar Chart
NGV17 $0.035 Kase Bar Chart

Because the wave $2.88 – 2.998 – 2.91 met its $2.99 smaller than (0.618) projection there is still a reasonable chance for a test of $3.03. However, a move below the $2.91 swing low would wipe out that wave and significantly dampen the odds for $3.03 and higher. Therefore, at this point, a move above either $2.99 or below $2.91 should give us a good idea of the direction for the next few days.

The market remains tight and may continue to oscillate in a narrowing range, but with all factors considered, tomorrow look for a test of $2.90 and possibly $2.87. A close below $2.87 would confirm a break lower out of the flag, opening the way for $2.84 and lower.

Should the $2.91 swing low hold and prices overcome $2.99, near-term odds will shift back in favor of challenging $3.03. A close above $3.03 would confirm a break higher out of the flag and call for $3.08 and ultimately $3.12.

This is a brief analysis for the next day or so. Our weekly Natural Gas Commentary and daily updates are much more detailed and thorough energy price forecasts that cover key natural gas futures contracts, calendar spreads, the UNG ETF, and several electricity contracts. If you are interested in learning more, please sign up for a complimentary four-week trial.

October WTI crude oil continues to work its way toward crucial support at $45.6. Most importantly, this is the 62 percent retracement of the move up from $42.52 to $50.51. It is also a confluent projection for the waves down from $48.91, $48.5, and $48.2. A move below initial support at $46.1 will clear the way for $45.6.

CLV17 Daily Chart
CLV17 Daily Chart

The confluence of projections at $45.6 makes it a potential stalling point. However, today’s $46.44 settle was below the $46.5 smaller than (0.618) target of the larger scale wave $50.51 – 46.62 – 48.91. Therefore, this wave should ultimately extend to its $45.0 equal to (1.00) target. An upward correction will likely take place once $45.6 is met, but while the $48.91 swing low holds, odds will favor an eventual decline to $45.0.

That said, unstable external factors have crude and products on edge. Therefore, the move up from $45.76 this afternoon was likely short covering. Resistance at $46.9 should hold tomorrow. A move above this would call for a test of Monday’s $47.2 midpoint. Even so, unless WTI settles above $47.8, which splits the difference between Monday’s open and the 62 percent retracement of the decline from $48.91, the near-term outlook will remain negative.

This is a brief analysis for the next day or so. Our weekly Crude Oil Commentary and daily updates are much more detailed and thorough energy price forecasts that cover WTI, Brent, RBOB Gasoline, Diesel, and spreads. If you are interested in learning more, please sign up for a complimentary four-week trial.

WTI crude oil fell sharply last Thursday after OPEC and other major producers announced an extension to production cuts through March 2018. This was expected by most, and according to media, the decline was due to disappointment that production cuts were not deeper, which many had hoped for.

U.S. shale production remains a concern, though stockpiles fell for a seventh straight week, a fact that many have seemed to overlook. In addition, some are reportedly wondering what OPEC’s plan for an exit strategy to the production cuts will be without flooding the market with supply again.

For now, the extension of the OPEC cuts has become a game of “wait-and-see”. They will undoubtedly have a longer-term impact on prices, but at this point, it is hard to tell how significant the impact will be.

Most technical factors are negative, though it is still a tight call. July WTI made up some ground since falling late last week. However, the formation of a head and shoulders pattern is negative for the near-term outlook. The pattern’s neckline is $48.1, a close below which would open the way for the move down to continue toward its $44.65 target.

July 2017 WTI Crude Oil - 35-Cent Kase Bar Chart
July 2017 WTI Crude Oil – 35-Cent Kase Bar Chart

The connection to $48.1 is made through $49.1 and $48.6, the 0.618 and 1.00 projections of the wave $50.28 – 49.03 – 49.83. Tomorrow, we expect prices to test $49.1 and $48.6. A close below the lower objective would call for $48.1, the 1.382 projection, which is also near the 0.618 projection of the larger wave, $52.0 – 48.18 – 50.28.

That said, should prices rise above $50.3, near-term odds would shift in favor of $51.1 and possibly higher. The $50.3 level is the top of the head and shoulder’s right shoulder and the 0.618 projection of the wave $48.18 – 50.28 – 49.03. The 1.00 projection is $51.1. Therefore, a close above $50.3 would significantly damage the head and shoulders formation and the likelihood of a break below its $48.1 neckline.

This is a brief analysis and outlook for the next day or so. Our weekly Crude Oil Commentary and daily updates are much more detailed and thorough energy price forecasts that cover WTI, Brent, RBOB Gasoline, Diesel, and spreads. If you are interested in learning more, please sign up for a complimentary four-week trial.