NY Harbor ULSD Crack Spread Update

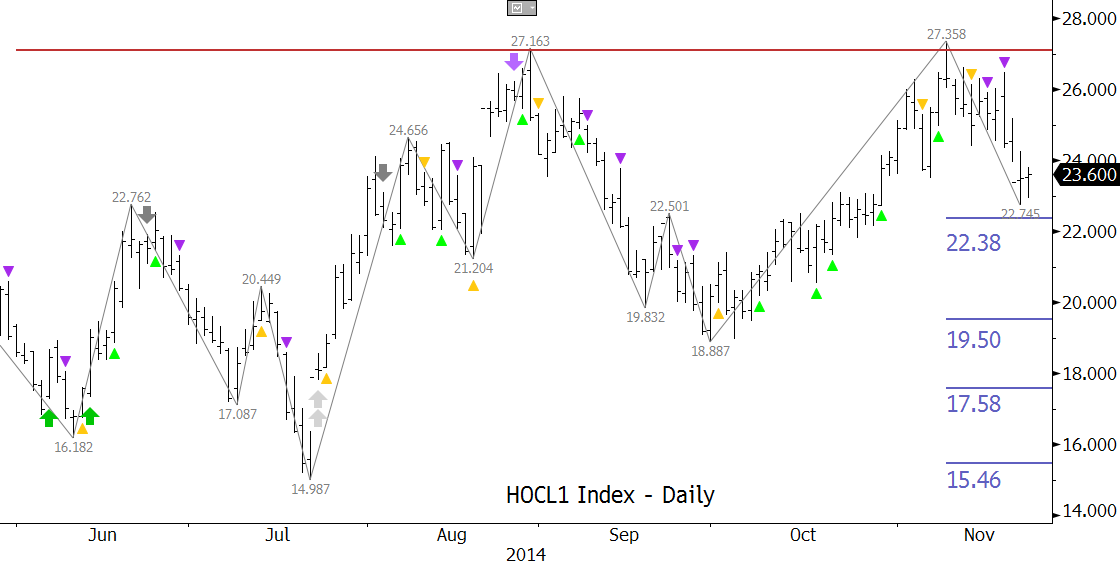
The HOCL crack spread has narrowed after forming a double top at $27.26. A close below the $18.887 swing low would confirm the pattern. KaseX also indicates the spread should narrow. However, the move may be corrective. Crucial support at $22.38 is the 62 percent retracement from $18.887 and the 38 percent retracement from $14.987. A close below $22.38 would call for $19.5; the last level protecting $18.887. Resistance at $25.6 is key. A sustained close over this would open the way for $31.14 and higher.

Please click the links for more information about KaseX and our energy forecasts.

HOCL


Kase’s senior analyst Dean Rogers reviews trade setups and price forecasts for e-mini S&P 500, crude oil, natural gas, AAPL, and VIPS using Kase Outlook, Kase StatWare, and KaseX.

http://youtu.be/pLCujMm5-WE

The WTI-Brent spread narrowed last week, but the move looks corrective. The spread will likely oscillate for the near-term, but ultimately odds favor a widening spread. The first target is (5.00), and a close below this would call for (6.50) and (9.00). Key long-term support is (11.80). This is a confluent wave projection and the 62 percent retracement from (19.38) to (0.01). Resistance at (0.90) should hold. A sustained close over (0.90) would open the way for 1.30 and 2.90.

For more information and to take a trial of Kase’s weekly energy forecasts please visit the Energy Price Forecasts page.

WTI-Brent


This is the fourth of a four part series on Kase Wave Analysis. In this video Kase’s senior analyst, Dean Rogers, shows how the Kase Wave Analysis can be combined with other technical factors and indicators to make trading decisions.

http://youtu.be/3JcHjdr2QWM

This is the third of a four part series on Kase Wave Analysis. In this video Kase’s senior analyst, Dean Rogers, demonstrates how to identify confluent support and resistance levels using Fibonacci wave projections. This is “where the rubber meets the road” with Kase Wave Analysis. Upon completion of this session you will be able to identify the key support and resistance levels using Kase Wave analysis.

Identify and remove wave projections that have been met by using swing highs and lows
Calculate True Range and determine an appropriate cluster size for confluence points
Demonstrate the ability to cluster wave projections into confluence points
Explain which support and resistance targets are the most crucial based upon confluence

http://youtu.be/aEQsFj-DRJ8

December 2014 NY Harbor ULSD futures have formed a rectangle pattern. A break out of the rectangle will provide a near-term direction. Monday’s close below Friday’s midpoint indicates the pattern will likely break lower. Upon a close below 243.5 look for the pattern to break lower and decline to at least 236.4, which then connects to 225.1 and 213.2. A close over 253.8 would call for a break higher, and would open the way for 259.7, 267.4, and 282.1.

For more information and to take a trial of Kase’s weekly energy forecasts please visit the Energy Price Forecasts page.

HOZ4

December WTI broke the recent and crucial $79.1 swing low when prices fell to a $78.14 intraday low on Monday. This was the 1.00 projection for the two largest waves down from $106.81 (Wave A) and $103.66 (Wave A’/C). WTI is now poised for at least $73.9 and possibly $69.8, which are the next targets for these waves. Look for near-term resistance at $79.8, $83.0, and $84.8.

For more information about this call, the importance of these targets (and others), and the technical factors driving prices lower, take a trial of Kase’s weekly energy forecasts.

December WTI


This is the second of a four part series on Kase Wave Analysis. In this video Kase’s senior analyst, Dean Rogers, explains how to calculate the nine core Fibonacci wave projections that Kase uses for analysis. Upon completion of this session, you will be able to calculate these projections for a series of waves.

Identify the impulse and corrective legs of a wave
Show how the Fibonacci sequence and Phi are derived
Explain why the Fibonacci sequence and Phi are important for wave analysis
Explain the difference between impulse and corrective wave projections
Demonstrate the ability to calculate impulse and corrective wave projections
Assemble a grid of Kase’s nine core Fibonacci wave projections for a set of waves

http://youtu.be/VuhSzm1obes


This is the first of a four part series on Kase Wave Analysis. In this video Kase’s senior analyst, Dean Rogers, explains how to identify and pick waves. Upon completion of this session, you will be able to assemble a list of the most important waves for analysis.

Identify proper swing highs and lows
Recognize the X, Y, and Z points of a wave
Identify valid, invalid, and irregular waves
Demonstrate the appropriate point at which to drop to shorter bar lengths
Produce a list of all of the appropriate up and down waves

http://youtu.be/8s1YfHhJtYk