WTI Crude Oil Unfolding as Five-Wave Trend

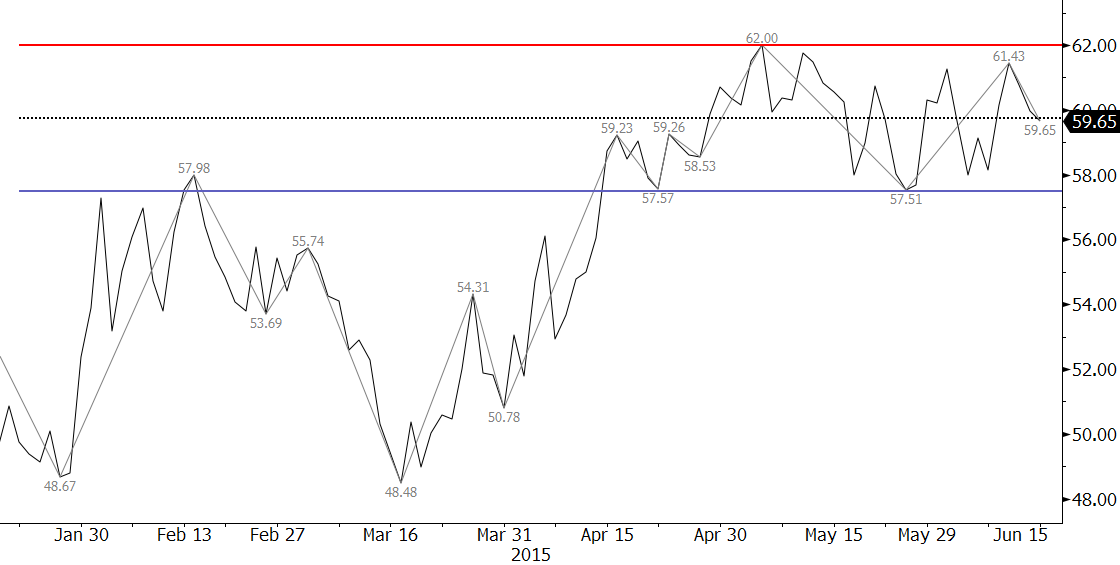
Prompt month WTI crude oil futures briefly fell below $50.0 on Monday and settled at the lowest level since April 2. The deal with Iran has led to fresh concerns about the global supply glut and most technical factors are negative. RBOB gasoline is lending some support, but on balance, the decline is poised to extend into the mid- and possibly low-$40s where the March 18th low of $42.03 would be challenged.

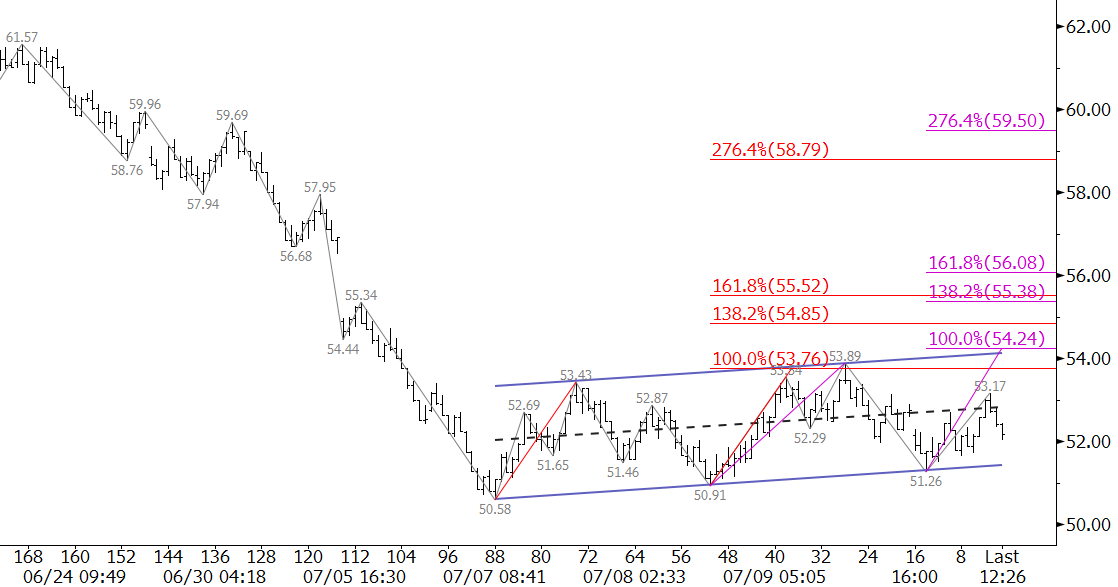
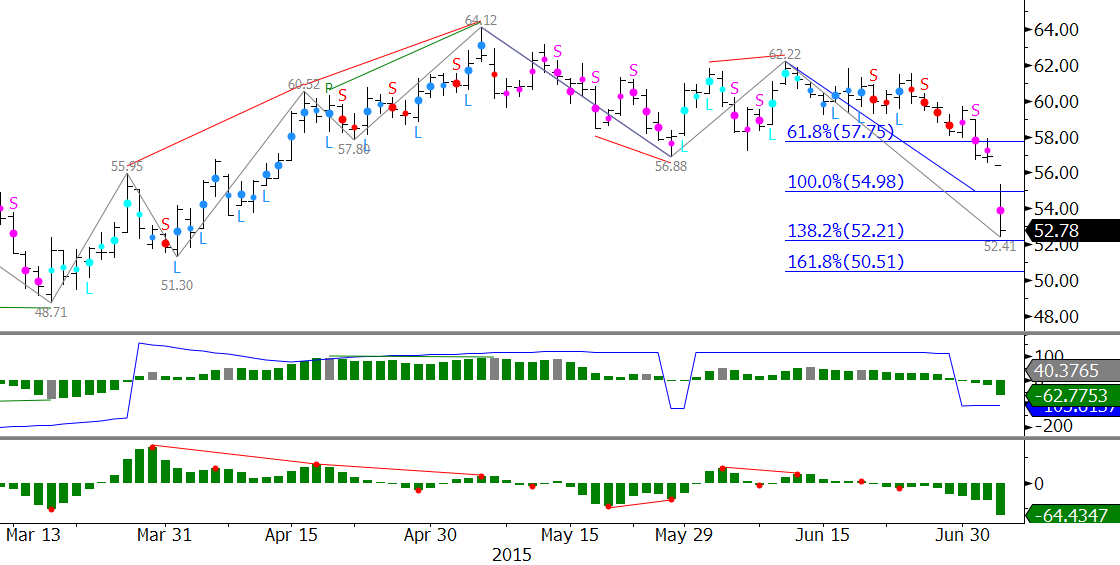
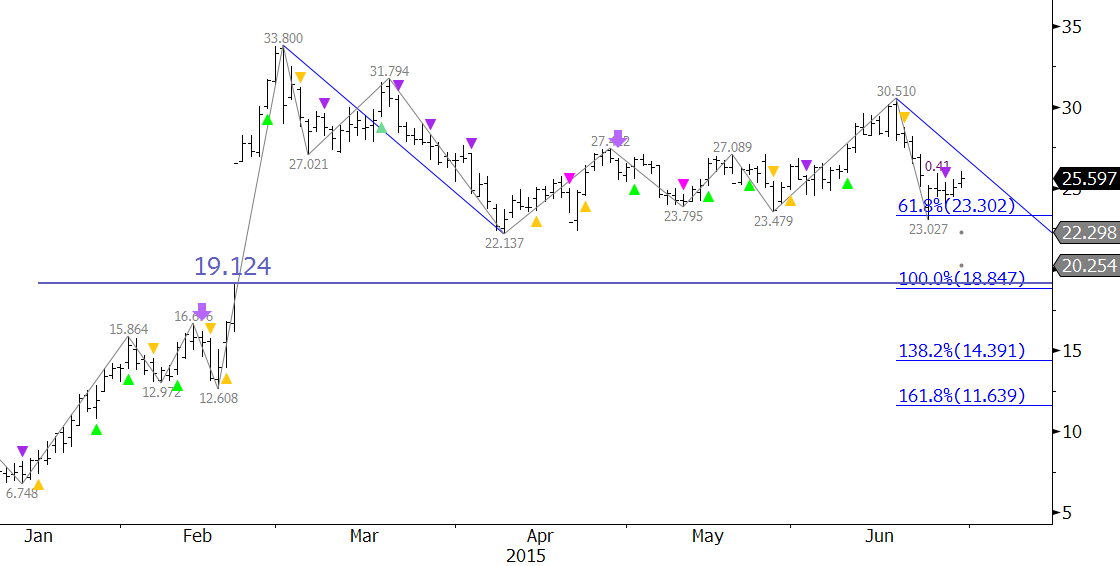
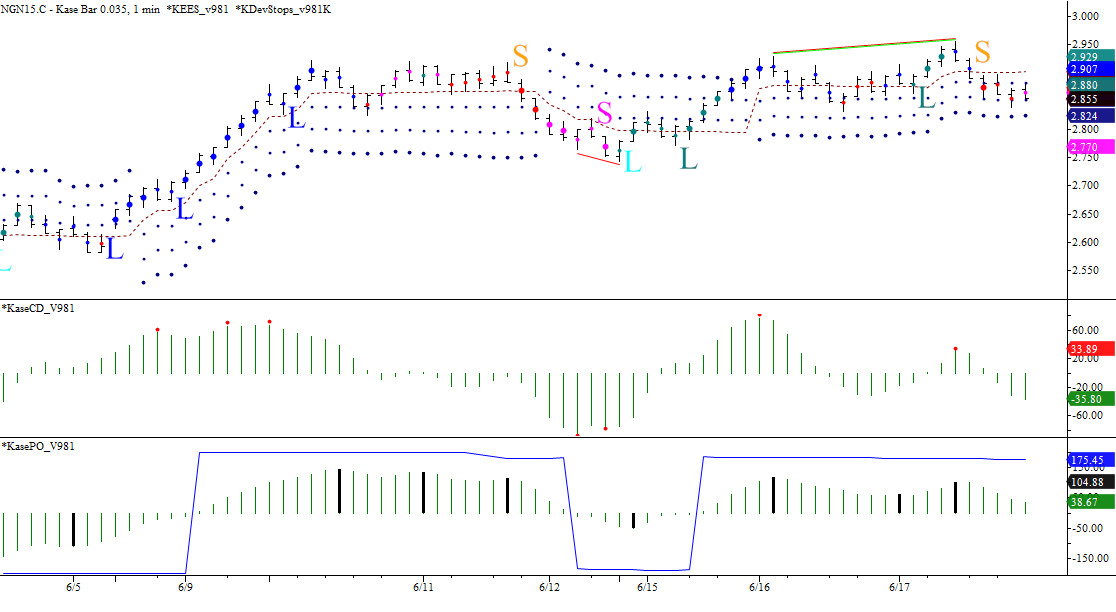
Prices broke lower out of the near perfect intraday bearish flag discussed last week. September WTI futures, which will become the prompt month on Wednesday, also settled below key support at $50.6 on Monday. This was the 1.618 projection of the wave $64.45 – 57.09 – 62.51. This is likely Wave I of a five wave trending pattern that should unfold to at least $47.0 and possibly $42.5. The five-wave pattern is not perfect, but the close below $50.6 and the bottom of Wave III leaves little room for any other interpretation.

WTI Crude Oil

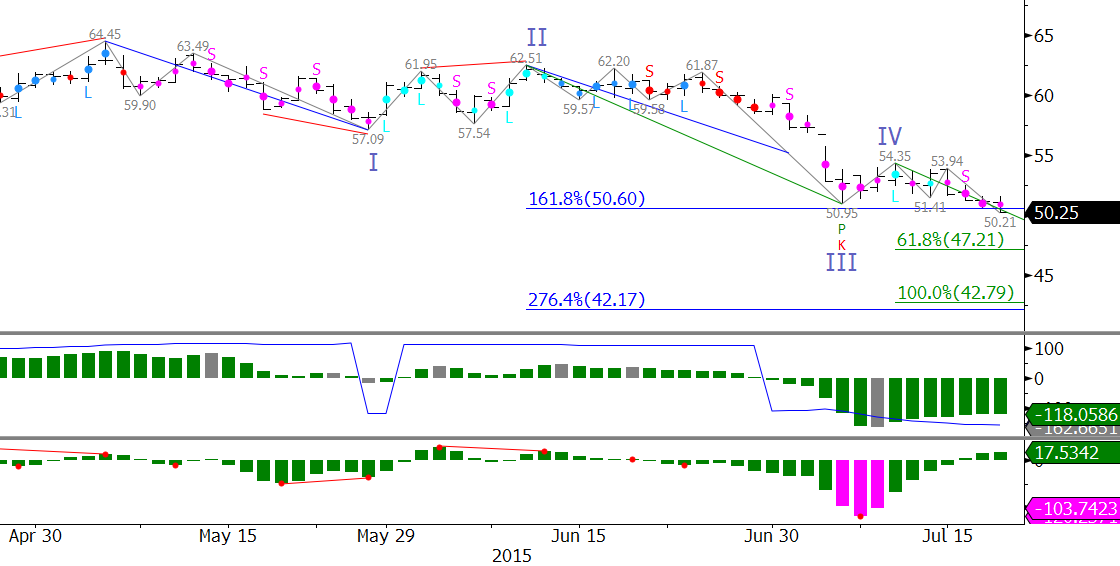
When a five-wave pattern forms at least two of the three impulse waves (I, III, or V) should be equal. At $47.0 Waves I and V will be equal and at $42.5 Waves III and V will be equal. Structurally, both $47.0 and $42.5 fit the structure of the five-wave pattern because $47.0 is the 0.618 projection of Wave III, $62.51 – 50.95 – 54.35 and $42.5 is the 2.764 projection for Wave I.

It is important to note that $42.5 is the lowest that the five-wave pattern projects. Therefore, unless the structure of the wave formation drastically changes, it is not likely that prices will fall below $42.5 in coming weeks.

Odds favor the decline, but the market still seems a bit unsure of itself. As stated, there is some support being wrought by RBOB gasoline, but it ended Monday on a negative note by forming an evening star setup. The move down will likely be a grind and small tests of resistance will be commonplace. First resistance is $51.8 followed by $52.8, which is expected to hold. Key resistance is the $54.35 swing high. A close above this would negative the five-wave pattern and open the way for an extended correction and potential recovery to $59.3 and higher.

Our weekly Crude Oil Commentary is a much more detailed and thorough energy price forecast. If you are interested, please sign up for a complimentary four week trial.

Perfect geometric formations are a rare commodity. They are useful gems of information that can tell us a lot about a market’s outlook and general direction. It is important to pay attention to the implications of a successful break out of the pattern, and it is even more important to watch for patterns that fail.

WTI’s bearish flag on the $0.50 Kase Bar chart is as close to a textbook example as one will ever see. Flags are extremely reliable continuation patterns. Because this flag formed after a decline, and is sloping upwards, it is a bearish pattern that indicates the move up is corrective and that the decline should continue.

WTI Crude Oil

The waves within the flag have fulfilled the 1.00 projection for the wave $50.58 – 53.43 – 50.91. This is significant because it is evidence that the move up is unfolding as a three-wave ABC pattern, which is more evidence that the move is corrective.

Prices settled in the lower half of the formation on Monday, which does not bode well for another test of the upper trend line. A close below $51.8, which is near the bottom trend line, would indicate the move down is going to extend to at least $49.9. Our detailed weekly analysis discusses the connections to targets in the mid- to low-$40s upon a break lower.

There is an outside chance that the formation will fail, but prices will need to close over $54.8 to prove that an extended upward correction and potential recovery is underway. Technically, the flag will fail upon a close over the upper trend line, which is currently $54.2. However, for many technical reasons, $54.8 is the threshold for a positive near-term outlook. Most importantly, it is near the 38 percent retracement of the decline from $62.22 and the midpoint of July 6th.

For now, watch the flag formation closely. Odds favor a break lower and close below $51.8. The directional breakout of this pattern will be a strong clue as to the direction of WTI for the next several weeks.

This is a brief analysis and outlook for the near-term. Our weekly Crude Oil Commentary is a much more detailed and thorough energy price forecast. If you are interested, please sign up for a complimentary four week trial.

After the 4th of July weekend the energy markets, unlike the weather across most of the U.S., heated up. The lack of warm summer weather in key areas of the county has given way to lower prices for natural gas. August natural gas futures finally closed below $2.73 on Tuesday and Wednesday. The move has been quiet relative to the noise being made by crude oil, but the break lower indicates prices should continue to decline. That said, the bullish KaseCD divergence and KasePO PeakOut (oversold signal) on the $0.035 Kase Bar chart indicate the decline will be a grind.

natural gas prices

The wave $2.977 – 2.733 – 2.885 took out its 0.618 projection at $2.73, therefore odds favor at least $2.64, its 1.00 projection. This is a highly confluent and important target that protects the $2.588 swing low. We expect to see a bounce from $2.64 given its importance. A close below $2.64 would call for $2.55 and $2.50.

The 38 percent retracement from $2.885 to $2.676 is $2.76. Key near-term resistance is $2.81, the 62 percent retracement. Both levels are in line with the two previous intraday swing highs of $2.756 and $2.80. A close over $2.81 is unlikely unless tomorrow’s Energy Information Agency (EIA) report is extremely bullish.

This is a brief natural gas forecast ahead of tomorrow’s EIA report. Our weekly Natural Gas Commentary is a much more detailed and thorough analysis. If you are interested in learning more, please sign up for a complimentary four week trial.

As predicted WTI crude oil has broken lower out of the recent trading range and fell by nearly eight percent on Monday. The important 1.382 projection was met at the $52.41 swing low. Key support at $50.5 should be tested tomorrow. We consider this a decision point for a much more bearish outlook and decline into the mid-$40’s. Today’s action may even dust up talks about the $30s again, though we think that conversation is a bit premature. Look for resistance at Monday’s $54.4 midpoint. This may be tested in early trading Tuesday, but should hold.

wti crude oil

This is a brief analysis and outlook for the near-term. Our weekly Crude Oil Commentary is a much more detailed and thorough energy price forecast. If you are interested, please sign up for a complimentary four week trial.

Markets are rarely more balanced that what we have experienced for natural gas over the past few weeks. After August failed to overcome $2.95 it stalled at $2.73, and is now in a mini-range between $2.73 and $2.87. Considering this week marked the end of the month and quarter, and is shortened due to the 4th of July holiday, a breakout will likely be delayed until next week.

The market is waiting for factors like summer weather and/or supply/demand issues to give us a breaking. The longer it delays the move up though, the more prices will erode away until it is too late to make a meaningful push higher.

It is still a bit early for the market to give up on a summer rally, but based on many technical factors we favor a break lower out of the mini-range between $2.73 and $2.87. This morning’s failed attempt to overcome $2.87, bearish KaseCD divergence and first short signal confirm our call. This would open the way for a confluent $2.64 target.

natural gas prices

Should prices close over $2.87 look for another test of $2.95, which is the key threshold for a push to levels above $3.00 and a summer rally.

This is a brief natural gas forecast ahead of tomorrow’s EIA report. Our weekly Natural Gas Commentary is a much more detailed and thorough analysis. If you are interested, please sign up for a complimentary four week trial.

The RBOB gasoline crack spread widened to $25.64 on Monday and could test $27.77 before narrowing again. Resistance near this level is expected to hold and the crack is poised to narrow now that the 0.618 projection of the wave down from $33.80 was met. We would look to short the crack spread soon because KaseX generated a filtered sell signal on June 25th. The key target at $19.00 is the 1.00 projection and the top of the gap that took place on February 23rd.

crack spread

This is a brief analysis and outlook for the near-term. Our weekly Crude Oil Commentary is a much more detailed and thorough energy price forecast. If you are interested, please sign up for a complimentary four week trial.

Day-to-day speculation regarding summer weather forecasts continue to dominate short-term natural gas prices. The lack of clarity has caused natural gas to settle into a range between $2.55 and $2.95 after failing to close over the upper end of the range last week.

Technical factors show that prices are due for a test of the lower end of the range where contract lows will be challenged. Because the wave down from $2.955 (shown in red) met its 0.618 projection we expect to see at least its 1.00 projection of $2.62. This is also the 0.618 for the wave down from $3.105 (shown in blue).

natural gas prices

That said, it is still early for support to give way to the longer-term bearish trend, so the decline will likely be a grind. Support at $2.71 is holding strong, but a disappointing EIA storage report tomorrow would clear the way for $2.62. This is a confluence point just like $2.71, so $2.62 should hold.

Key resistance is $2.83 because it is in line with the $2.837 swing high. Overcoming $2.837 will take out the wave down from $2.955 and negate the near-term potential for $2.62.

This is a brief natural gas forecast ahead of tomorrow’s EIA report. Our weekly Natural Gas Commentary is a much more detailed and thorough analysis. If you are interested, please sign up for a complimentary four week trial.

RBOB gasoline prices are weak after stalling at 218.58. This was an important confluence point because it was the 50 percent retracement of the decline from 315.2 and the 0.618 target for the wave up from 122.65. The move up was exhausted once it reached 218.58 and negative factors like a bearish KasePO divergence have shifted near-term odds in favor of a pullback to 199.7 and 188.1 over the next few weeks.

RBOB Gasoline

That said, the pullback is most likely corrective.

Our studies show that nearly 80 percent of waves that meet the 0.618 target extend to at least the 1.00 target, which is 244.39 for the wave up from 122.65. This is also near the 62 percent retracement from 315.2. The only way to negate a wave’s projections is to take out the swing low of its correction, in this case, 169.25. Therefore, while 169.25 holds the longer-term outlook for gasoline is positive and favors an extension to 244.39.

Taking out the 244.39 swing low would be extremely bearish for gasoline prices. Right now we don’t that will be the case, but closing below 188.1 support will go a long way to increasing the odds of ultimately taking out 169.25.

This is a brief analysis and outlook for the next day or so. Our weekly Crude Oil Commentary is a much more detailed and thorough energy price forecast. If you are interested, please sign up for a complimentary four week trial.

Last week we discussed the chart below and the importance of $2.92 as the 0.618 projection of the wave up from $2.54 (not shown) and the 62 percent retracement from $3.15. The chart is being shown again, with a few updates, because not much has changed over the past week.

Natural Gas Projections

The crucial $2.92 level has been tested four times now, including this morning’s brief excursion to $2.955. Because prices failed to close over $2.92 again, we expect to see another oscillation lower to challenge support at $2.80. This is the 38 percent retracement of the move up and is near Monday’s $2.83 midpoint and Tuesday’s $2.831 low.

The bearish KaseCD and KasePO divergence and the DevStop2 hit on the $0.035 Kase Bar chart support the move lower and test of $2.80 tomorrow.

Natural Gas Divergences

Tomorrow’s EIA may be the catalyst the market needs to either close over $2.92 or below $2.80. A close over $2.92 has strong bullish implications as discussed in our weekly natural gas forecast. A close back below $2.80 would call for another test of support and possibly the contract lows. For now, $2.92 and $2.80 are the levels to watch for clarification of the near-term, and possibly the longer-term, direction.

This is a brief analysis ahead of tomorrow’s EIA report. Our weekly Natural Gas Commentary is a much more detailed and thorough analysis. If you are interested, please sign up for a complimentary four week trial.

The crude oil market as a whole has continued to be dominated by stale and conflicting fundamental, technical, and geopolitical factors. These factors have brought about as much balance to the crude oil markets as Anakin Skywalker brought to the force. The most interesting factor is that many market participants seem to forget that markets have three direction: up, down, and sideways. Right now, WTI is stuck in a mind numbing sideways range. I say this because it is almost as exciting as watching the grass in my backyard grow.

During times like this we tend to grow impatient and frustrated. The easiest way to deal with a range bound market is to walk away, take a few deep breaths, work on our short game, and come back to play another day. However, we don’t all have that luxury, and have no choice but to participate and be driven insane by the constant change of direction and endless supply of chalky antacids we are popping like candy.

Luckily, technical analysis can help us to clarify the crucial breakout points for this range. Our models, which are based upon a combination of many different technical factors, show crucial resistance at $62.0 and support at $57.5. In addition, the line on close chart shown below confirms that these are the clear boundaries of the trading range. A break out of this range will help determine the direction for the next few months.

crude oil

The challenge is that it is nearly a toss-up as to which direction the market will break.

Our weekly Crude Oil Commentary goes into great detail about the implications of a break higher or lower out of this range. We break down the wave formations, retracements, candlesticks, momentum, and other factors. The bottom line is that the range may be corrective, which means prices should break higher. However, our models show that that $57.5 will be tested at least once more before WTI closes over $62.0.

This is a brief analysis and outlook for the next day or so. Our weekly Crude Oil Commentary is a much more detailed and thorough WTI and Brent crude oil price forecast. If you are interested, please sign up for a complimentary four week trial.