Crude Oil Forecast: WTI Poised to Challenge Critical Support

By Dean Rogers

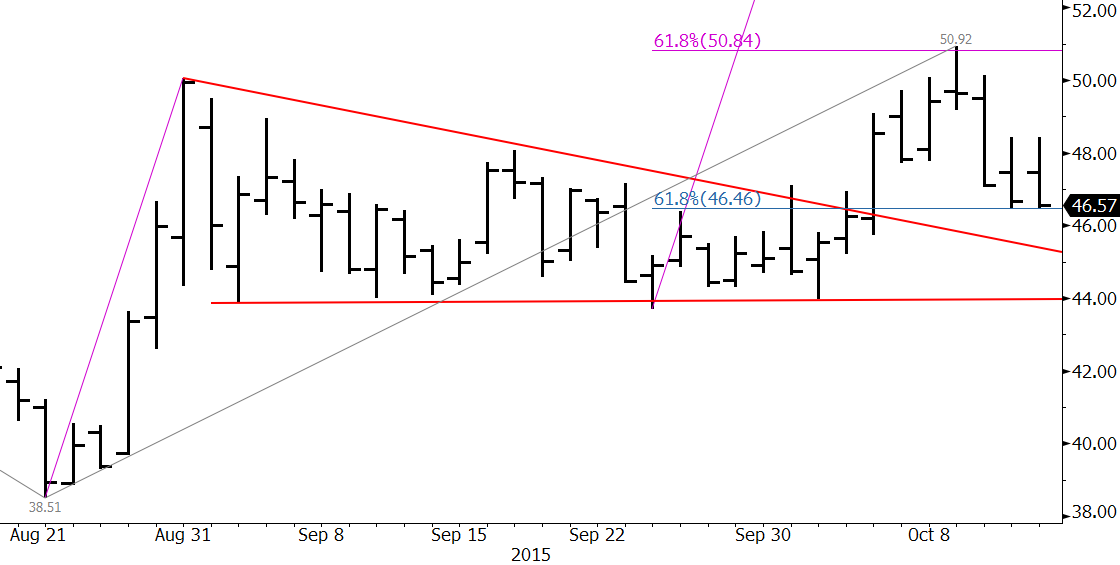
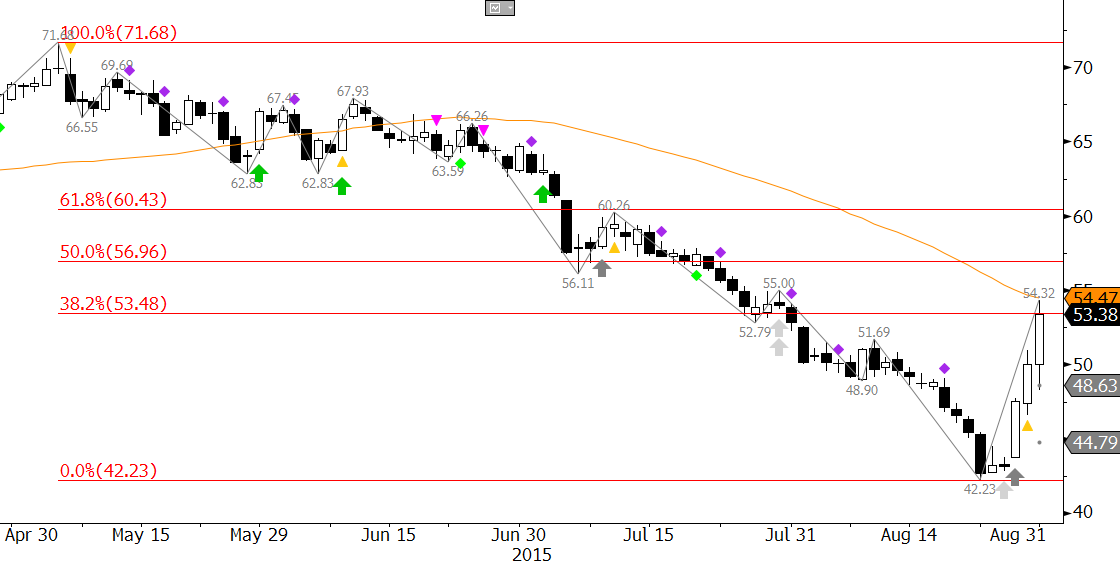
December WTI’s wave $39.22 – 50.89 – 44.31 met its 0.618 projection at $51.42. This was positive, especially due to the break higher out of the bullish pennant formation. We anticipated the pullback from $51.42, but so far it has been stronger than expected and is poised to test major support levels at $46.0 and $44.3.

Kase’s studies show that waves that meet the 0.618 projection extend to the 1.00 projection 80 percent of the time. This would have pushed prices to $56.0. However, the pullback from $51.42 has been strong and closed below $47.0 support on Monday. Therefore, this may be 20 percent of the time that a wave fails to meet its 1.00 projection.

CLZ5 20151019

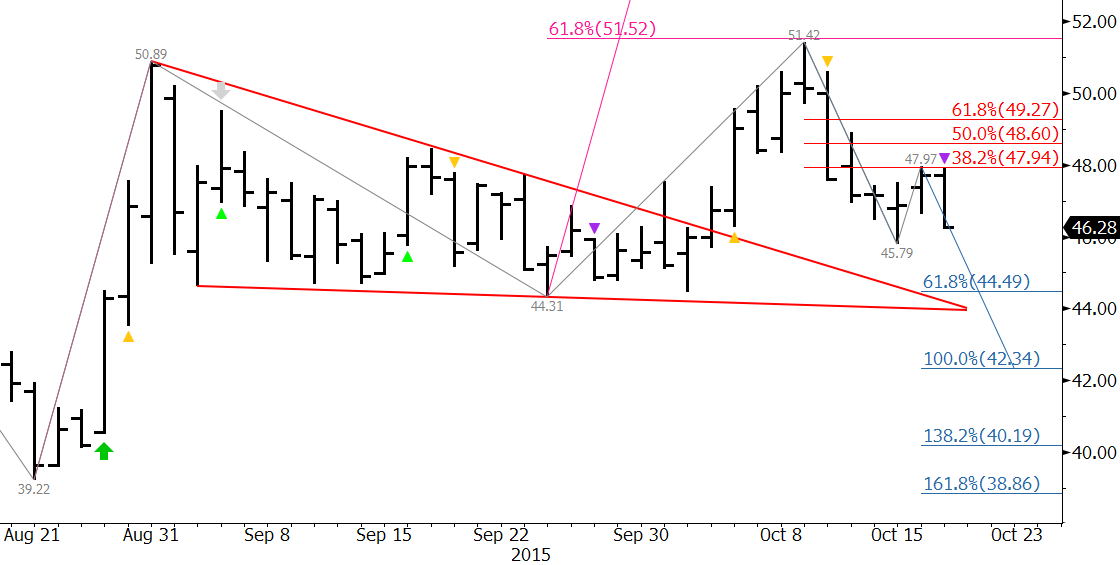
First support is $46.0, and a close below this would open the way for $44.31. This is the swing low of the wave up from $39.22 and is in line with the 0.618 projection of the wave down from $51.42. Taking out $44.31 would result in a technical failure of the move up and call an extremely bearish outlook for foreseeable future.

Look for immediate resistance at $46.9, $47.6, and then $48.4.

This is a brief analysis and outlook for the next day or so. Our weekly Crude Oil Commentary is a much more detailed and thorough energy price forecast. If you are interested, please sign up for a complimentary four week trial.

By Dean Rogers

Last week’s break higher out of the bullish pennant was positive and the move up extended to meet the 0.618 projection of the wave $38.51 – $50.04 – 43.71. However the move stalled there, formed a bearish evening star and blow-off high, and then proceeded to test $46.4, the 62 percent retracement of the move up from $43.71.

CLX5 20151013

The market is telling us that it needs more time to sort itself out as it awaits more data. We have stated that the move up would likely be a grind higher, and so far that has been the case.

For now, another trading range will likely form between $46.4 and $50.0. Look for resistance at $47.4 and $48.2.

Should prices fall below the $43.71 swing low the outlook will shift back to negative for the longer-term.

This is a brief analysis and outlook for the next day or so. Our weekly Crude Oil Commentary is a much more detailed and thorough energy price forecast. If you are interested, please sign up for a complimentary four week trial.

By Dean Rogers

November natural gas had worked its way higher to challenge key resistance at $2.53 over the past few days after meeting major support at $2.403 last week. The move up has been shallow and choppy compared to the decline and could be interpreted as a bearish expanding wedge. The market also keeps giving back its intraday gains at the end of each day, which indicates hesitance to continue higher. This point is emphasized by the formation of an intraday double top at $2.53.

NGX15 20151008

The completion point for the double top is $2.45, which is also in line with the wedges lower trend line. A close below this would confirm the double top and a break lower out of the wedge, opening the way for another test of $2.40 and possibly lower.

That said, a few positive factors, including bullish daily divergences and a morning star still show that the upward correction could extend to $2.60. The key for a move of this magnitude is for $2.45 to hold and a close over $2.53. The latter is the morning star’s confirmation point, the 1.00 projection for the wave $2.403 – 2.491 – 2.436, and the 38 percent retracement from $2.72 to $2.403.

On balance, with all factors considered, it is looking more and more like natural gas will settled into a trading range between $2.40 and $2.53 for a few weeks while awaiting external factors (weather) to sort out the direction for the next few months.

This is a brief natural gas forecast. Our weekly Natural Gas Commentary is a much more detailed and thorough analysis. If you are interested in learning more, please sign up for a complimentary four week trial.

By Dean Rogers

For the past few weeks each bit of positive crude oil news or fundamental data has seemingly been offset by something negative. As a result, November Brent has settled into a rectangle formation with boundaries between $47.0 and $50.3.

The upper boundary of the rectangle is poised to be challenged after Monday’s move up to $49.87. The pullback at the end of the day indicates another oscillation lower might take place first, but for now, odds still favor a break higher. A close over $50.3 would call for at least $51.7.

Main20151005152653

Conversely, Brent’s move up has already failed once after breaking higher out of a bullish pennant on September 15. Since then the rectangle has formed. Should the rectangle fail, and prices close below $47.0, look for at least $45.3.

This is a brief analysis and outlook for the next day or so. Our weekly Crude Oil Commentary is a much more detailed and thorough energy price forecast. If you are interested, please sign up for a complimentary four week trial.

By Dean Rogers

Natural gas had oscillated in an expanding triangle since August 24. Monday’s break higher out of the pattern was positive, but stalled at $2.794, the 50 percent retracement from $2.959 to $2.632.

The move to $2.794 was healthy because the decline had become stale. The rally gave bears a new opportunity to short the market.

Tuesday’s close below Monday’s $2.73 midpoint formed a daily dark cloud cover (bearish), and Wednesday’s close below $2.70 confirmed the pattern. This is also in line with the 62 percent retracement from $2.632 to $2.794.

natural gas

Caution is warranted and trading will likely remain choppy, but the bearish technical factors indicate another test of $2.63 is expected. A close below this would open the way for the decline to $2.55 and lower have expected for several weeks.

This is a brief natural gas forecast ahead of tomorrow’s EIA report. Our weekly Natural Gas Commentary is a much more detailed and thorough analysis. If you are interested in learning more, please sign up for a complimentary four week trial.

By Dean Rogers

Unseasonably warm weather for early September has supported prices in the prompt month and prices were trading in a tight range between $2.64 and $2.725.

Late Wednesday afternoon October natural gas finally broke lower and a new contract low was made. In addition, the winter strip also fell to new lows again confirming the negative outlook.

Look for at least $2.59 ahead of tomorrow’s EIA storage report and possibly $2.53 before the end of the week.

natural gas

Trading will remain choppy, so another test of $2.72 and possibly $2.77 is not out of the question. We expect $2.77 to hold. A close over this would call for an extended upward correction.

This is a brief natural gas forecast ahead of tomorrow’s EIA report. Our weekly Natural Gas Commentary is a much more detailed and thorough analysis. If you are interested in learning more, please sign up for a complimentary four week trial.

By Dean Rogers

Many market participants are skeptical of Brent’s meteoric rise over the past three days. However, there is no denying the positive technical factors that indicate a bottom has likely been made. The monthly morning star setup and hammer, weekly bullish engulfing line, and daily three white soldiers candlestick patterns are reliable reversal patterns. KaseX also triggered reversal signals (gray arrows) early last week.

Brent Oil

Brent is on the teetering edge of confirming a sustained bullish outlook and has risen to the 50-day moving average at $54.47, the 38 percent retracement from $71.68, and the upper standard deviation band. A close over $54.5 will confirm a positive outlook and call for $55.4 and higher.

That said, because of the confluence of technical resistance at $54.5 this is a very likely stalling point. We expect a test of support at $51.9 within the next few days and likely before Brent closes over $54.5. A close below $51.9 would call for $50.6 and $49.7. The latter must hold for the near-term outlook to remain positive.

This is a brief Brent oil forecast and outlook for the near-term. Our weekly Crude Oil Commentary is a much more detailed and thorough energy price forecast. If you are interested, please sign up for a complimentary four week trial.

targetBy Dean Rogers

It has been a wild week on Wall Street and for markets around the world. Global equities have ridden a roller coaster in the U.S., Asia, and Europe, the U.S. Dollar strengthened a bit after a tumultuous decline, and oil is trying to find its bottom after a significant rally to $42.86 from our weekly commentary’s $37.9 target.

U.S. 10 Year Treasury bonds have come along for the ride and have fallen to 127’18 so far after stalling at 129’28. The 129’28 high was just above our June 30, 2015 projected resistance of 129’16.5. At this point, as shown in the chart below, bearish momentum divergences formed when rising price highs were accompanied by falling momentum highs on the KaseCD, MACD, and slow stochastic.

TY daily

The divergences show that the decline will likely extend. However, there are several positive technical factors that indicate an upward correction should take place first.

The daily candlestick chart above shows a morning star setup that formed on August 27. The confirmation point (open of August 26) is 128’18. This resistance level is also in line with the 38 percent retracement of the decline form 129’28 as shown in the chart below. Should the decline extend as expected over the next few days, 128’18 must hold. A close over this would call for 128’31.5, the 62 percent retracement.

TY weekly

The wave formation down from 129’28, shown in green below, met the 0.618 projection at 127’18. Most waves (our studies show around 77 percent) that meet the 0.618 projection extend to at least the 1.00 projection, in this case 126’27. Therefore, odds favor at least 126’27. This is in line with the 62 percent retracement of the move up from 124’29 as shown in the daily chart (in blue). A close below 126’27 would call for 126’08 and 125’26.

In summary, for the near-term, these technical factors indicate U.S. 10 year treasuries should decline to at least 126’27, but that a small correction to 128’18 might take place first. The longer-term targets are discussed in our original article published June 30, 2015.

By Dean Rogers

Natural gas continues to hold the lower end of the trading range between $2.65 and $2.95 on a closing basis. October natural gas futures stalled at $2.641 and subsequently formed a bearish flag (blue trend lines). Flags are generally a reliable type of continuation pattern, which means the flag should break lower soon. The next targets are $2.62 and $2.55.

natural gas

A daily morning star setup (not shown) indicates the upward correction may extend. Resistance at $2.75 should hold. This is the 38 percent retracement from $2.959, the 62 percent retracement from $2.816, and the 1.382 projection of the wave up from $2.641. A close over $2.75 would confirm the morning star and call for an extended correction $2.80 and possibly $2.85.

Overall, our bias remains negative. Therefore, even if prices rose to test resistance we expect $2.75 to hold and for natural gas to continue its decline.

This is a brief natural gas forecast ahead of tomorrow’s EIA report. Our weekly Natural Gas Commentary is a much more detailed and thorough analysis. If you are interested in learning more, please sign up for a complimentary four week trial.