Crude Oil Forecast: Bullish Piercing Pattern is Early Sign of WTI Correction

By Dean Rogers

The darkest hour is just before the dawn. It is a phrase that most are familiar with that provides hope, even in the worst of circumstances. The outlook for WTI crude oil prices has been “dark” in recent weeks, and the longer-term outlook is still dim. However, December 14’s close over $36.13 provides a small shimmer of hope that a correction might finally be underway.

January WTI met a confluent and structurally crucial support target near $35.0 on December 14 and closed above December 11’s $36.13 midpoint to form a bullish piercing pattern. The piercing pattern is an early indication that a sustainable correction might finally be underway. A close over the pattern’s $36.63 confirmation point (December 11’s open) would call for at least $37.9, the 38 percent retracement from $43.46 to $34.53.

CLF6 20151214

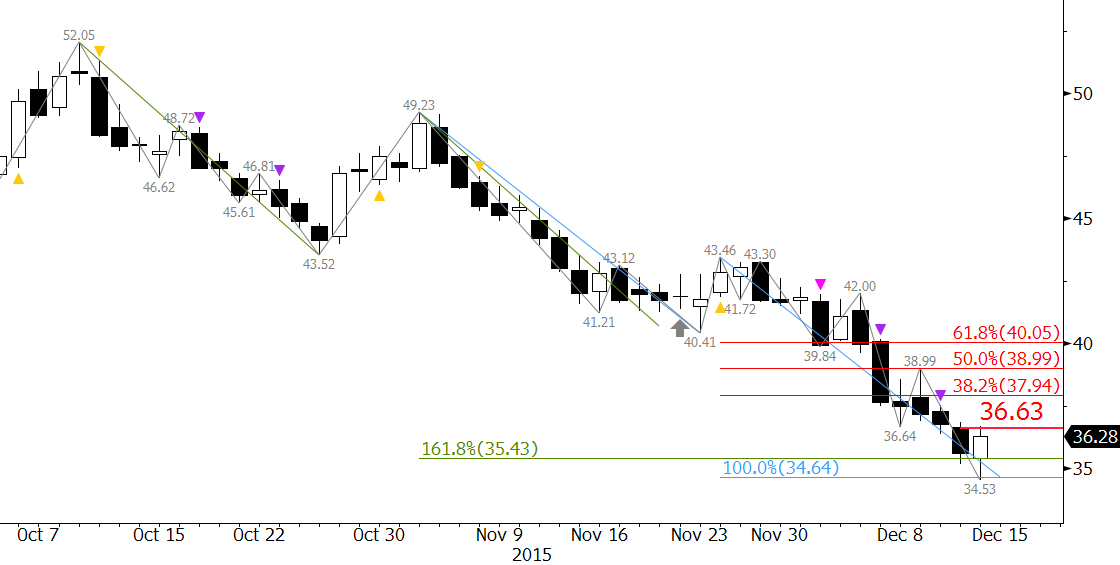
The move up will most likely be corrective, but a substantial correction is long overdue. KaseX is not showing any signs of a turn yet, and the piercing pattern’s $36.63 confirmation point was tested and held. This dampens the likelihood of a reversal, but does not wipe out the potential completely. A close below $35.4 would negate the piercing pattern and call for the decline to continue towards the December 2008 perpetual swing low of $32.4.

Therefore, if the sun is going to rise $35.4 must hold and January WTI will need to close over $36.63 and then $37.9 within the next few days.

This is a brief analysis and outlook for the next day or so. Our weekly Crude Oil Commentary is a much more detailed and thorough energy price forecast. If you are interested in learning more, please sign up for a complimentary four week trial.

By Dean Rogers

Natural gas’s upward correction has been held at bay as the market seeks frigid temperatures to support a move higher. January is settling into the familiar range between approximately $2.26 and $2.39 that December oscillated in before it finally broke lower. This is likely where prices will remain for the rest of the week due to the Thanksgiving holiday.

The move up is corrective, and that point was verified on Wednesday when prices initially broke higher out of an intraday coil and subsequently stalled at $2.347 before overcoming the $2.351 swing high.

NGF6 20151125

Meeting the 0.618 projection for the wave $2.229 – 2.351 – 2.258 indicates January could still test $2.39, which is near the 1.00 projection and the 38 percent retracement of the decline from $2.60 to $2.229, as long as the $2.258 swing low holds. However, without support from external factors (cold temperatures) the market will be hard pressed to rise above $2.39 and extend to the next confluence point of $2.48.

Odds favor the decline and a test of $2.26 by the end of this week. This is a tough call right now because the market is sitting on major support, and external factors could turn this market higher in a heartbeat. Therefore, provided $2.26 can hold, there is still a reasonable chance the upward correction will extend to $2.39, but at this point we would not hold our breath.

Happy Thanksgiving to all!

This is a brief natural gas forecast for the next day or so. Our weekly Natural Gas Commentary is a much more detailed and thorough analysis. If you are interested in learning more, please sign up for a complimentary four week trial.

By Dean Rogers

January WTI futures met crucial support at $40.41 early Monday. This was the 1.00 projection for the wave $52.02 – 43.52 – 49.23. The subsequent move up was initially promising for bulls, but stalled at $42.75 before it could overcome $43.2 resistance.

CLF6 20151123-DIt is a tight call tomorrow, but we expect a test of $40.9 before the move up continues. This is confirmed on the intraday charts by the latest KaseX weak short signal (pink triangle). Support at $40.9 is near the 0.618 projection of the wave $42.75 – 41.09 – 42.62 and the $41.09 swing low. A close below $40.9 would call for $40.0 and possibly lower.

CLF6 20151123

Conversely, not all hope is lost for the upward correction to extend. The daily chart’s Kase Easy Entry System (KEES) permissions shifted from first class short (pink dots) to second class long (light blue dot). Therefore, there is still a reasonable chance for a close over $43.2 and an upward correction to $43.8, the 38 percent retracement from $49.23 to $40.41. A close over $43.8 would significantly increase the probability for an extended move to test major resistance levels.

This is a brief analysis and outlook for the next day or so. Our weekly Crude Oil forecast is a much more detailed and thorough energy price forecast. If you are interested, please sign up for a complimentary four week trial.

By Dean Rogers

As we stated last week, the natural gas call is extremely tight right now. The market can only tell us what it knows about itself, and right now the market is not sure what it knows.

The move up from $2.188 stalled at $2.398 on November 6, and since then prices have worked their way lower in an extremely choppy manner to test major support at $2.25. This level held on today’s close, so technically prices are still trading within the range.

The market is waiting on cold weather to push it higher, but today’s price action did not help short-term bulls. It will eventually get cold and prices will rise, but today’s decline to $2.25 puts odds slightly in favor (around 60 percent) of a decline to test least $2.20 and possibly $2.12 over the next few days.

NGZ5 20151111

That said, $2.25 is an extremely important and highly confluent wave projection and retracement that has been tested a few times and has held on a closing basis since the move up from $2.188 began on October 30. Therefore, caution is warranted, and given the circumstances, we would not be at all surprised to see $2.25 continue to hold.

From a trading strategy standpoint, this is a time that we would normally recommend sitting on the sidelines for a bit while waiting for a more concise direction and break out of the $2.25 to $2.37 range. Upon a close below $2.25 or above $2.37, a trade may be taken upon a confirming long or short signal from indicators like Kase StatWare or KaseX. Shorter bar lengths are also recommended because they will help limit risk and should be used to pinpoint entries and exits and determine stop levels until there is a close either below $2.12 or above $2.48. At that point a clear long-term trend will have been established and trades may then be scaled to longer bar lengths with wider stops.

This is a brief natural gas forecast ahead of tomorrow’s EIA report. Our weekly Natural Gas Commentary is a much more detailed and thorough analysis. If you are interested in learning more, please sign up for a complimentary four week trial.

By Dean Rogers

WTI stalled near $48.0 as we expected in our weekly Crude Oil Commentary and the sustained close below $44.7 calls for a test of key support at $43.2. This is a confluence area that is near the 0.618 projection of the wave $51.42 – 42.58 – 48.36. A close below $43.2 would confirm the negative outlook and open the way for a continued decline.

The Kase Easy Entry System (KEES) confirms the negative bias. Today’s pink dot indicates that the majority of momentum indicators are permissioned short on the daily chart and that the synthetic three-day filter is also permissioned short.

CLZ5 20151109

That said, the shorter intraday bar lengths are showing that the decline from $48.36 is a bit overextended, exhausted, and due for a correction. The correction will most likely take place once $43.2 is met. First resistance is $44.5. Key resistance is $45.4, the 38 percent retracement from $48.36 to $43.64. Both levels are in line with the opening prices of the last few days. A close over $45.4 would call for an extended upward correction and a likely trading range for the near-term.

This is a brief analysis and crude oil forecast for the next day or so. Our weekly Crude Oil Commentary is a much more detailed and thorough energy price forecast. If you are interested, please sign up for a complimentary four week trial.

sugarBy Cynthia Kase

The market’s been watching the impact of El Niño since June. Then the National Oceanic and Atmospheric Administration said there was a 90 percent chance the baby would stick around all summer, and maybe even into 2016. Sugar has been rising since mid-August, as El Niño persisted, but turned choppy in October only to break to 15.53¢ as of the 3rd.

Apparently Niño’s wet weather is delaying the sugar harvest and fears have grown about undersupply. The technicals have been positive but slammed up against resistance at 15.53¢. So while it’s too soon to say if 15.53¢ is “it”, there is likely more downside.

15.53¢ is important for a few reasons. It failed by 5 points to reach the 21 percent retracement of the entire move down from 36.08¢ to 10.13¢ on the continuation chart. Second, the Stochastic and RSI momentum indicators were set up for bearish divergences at that price. Most important, 15.53¢ was a confluent target, as shown in the chart. That price is just 0.01 points shy of March’s “trend terminus” target (12.55^3/11.28^2) for the first wave up from 11.28¢.

SBH6_Fig1Charts created using TradeStation. ©TradeStation Technologies, Inc. 2001-2015. All rights reserved. No investment or trading advice, recommendation or opinions are being given or intended.

First support was met on Wednesday at 14.64¢. Next is 14.40¢, just 7 points below Thursday’s low. This is the 21 percent retracement for continuation’s entire move up, and a confluent retracement for the intermediate swings on both charts. It is also the 0.62 projection for the wave 15.53 – 14.47 – 15.05.

The key question is whether the decline, which only reached 15.47¢ versus 15.40¢ support, is over. The fact that the bounce up from 15.47¢ formed an ABC pattern where C is the 1.62 extension of A, exactly, and that prices then declined to 14.59¢, that is, below the prior 14.64¢ swing, means probably not.

14.40¢ remains to be broken, so a continued decline is not a sure thing, but 14¢, the major threshold, is likely.

The open and midpoints of candlesticks constitute support and resistance. Last week’s midpoint was 14.37¢ and the open for the week ending October 9, the last large up week prior, was 13.92¢. There’s also an important swing at 13.94¢. So as long as this holds (the lower end of a 14¢ +/- 0.1¢ range), odds are open for the bull market to resume.

Initial resistance is 15.40¢. The decline isn’t dead unless this is overcome. Above this, a highly confluent 15.95¢, the last remaining target (the Phi^3 corrective projection) for the first wave up, and occurs as a target 10 times for the 10 waves up from mid-October’s 13.69¢ swing low. The highest price to which the March chart projects which has a moderate probability is 18¢, the 0.62 projection of the entire move up.

Send questions to askkase@kaseco.com, and click the link learn more about Cynthia Kase’s latest video series, Kase on Technical Analysis.

By Dean Rogers

Natural gas cautiously rose to $2.317 to fulfill the smaller than (0.618) projection for the wave $2.188 – 2.336 – 2.231. Typically, a move to $2.38 would now be expected because waves that meet the 0.618 projection normally extend to at least the equal to (1.00) projection. The pullback to $2.255 is a bit worrisome, but until the $2.231 swing low is taken out odds favor of a move to $2.38. This is a crucial target because $2.38 is the 38 percent retracement from $2.78 to $2.188 and makes a connection to $2.48 where last week’s gap would be filled.

NGZ5 20151104

KaseX warned that the decline from $2.317 would extend (yellow triangle), and as stated, support at $2.25 is already being challenged. A move below $2.231 would take out the wave up from $2.188 and its projections to $2.38 and higher. This would in turn shift odds back in favor of a decline to $2.11 to fulfill the requirements of the textbook five wave pattern down from $3.391 as discussed last week.

This is a brief natural gas forecast ahead of tomorrow’s EIA report. Our weekly Natural Gas Commentary is a much more detailed and thorough analysis. If you are interested in learning more, please sign up for a complimentary four week trial.

By Dean Rogers

Last week several top refiners reported a jump in their third quarter earnings compared to a year ago. Attractive crack spreads and refining margins due to lower oil prices and healthy demand for gasoline have helped refiners pump in profits. In addition, last week’s rise in oil prices, which was partially attributed to a quick turnaround in the refinery maintenance season, has helped to stabilize gasoline futures and open the way for a test of key resistance near $1.43.

December gasoline futures have oscillated in a trading range bound between approximately $1.26 and $1.43 since early September. The most recent move up from $1.26 overcame resistance at $1.36 and is now poised to test the upper boundary of the range at $1.43. This is the 2.764 projection for the small wave $1.2621 – 1.323 – 1.2627, the 0.618 projection for the wave $1.1756 – 1.4604 – 1.2621, and the 38 percent retracement of the decline from $1.8392 to $1.1756. There is a good chance that $1.43 will hold, but a close over this would open the way for at least $1.55.

XBZ5 20151102

The Kase Easy Entry System (KEES), which is based upon a sophisticated algorithm that accounts for multiple momentum indicators, bar lengths, swings, and bar structure, confirms the positive bias in the near term. The blue dot indicates that the underlying indicators and bar lengths are permissioned for long trades to be taken.

Prices are expected to reach at least $1.43 before another turn lower to test support takes place. For now, look for immediate support at $1.31 and for key support at $1.26. A close below the latter would call for the late August low of $1.1756 to be challenged.

This is a brief analysis and outlook for the next day or so. Our weekly Crude Oil Commentary is a much more detailed and thorough energy price forecast. If you are interested, please sign up for a complimentary four week trial.

By Dean Rogers

As discussed last week, everyone is looking for the natural gas bottom. I am sure no one wants me to step back onto my “picking bottoms is a dangerous game” soap box, so I will just reiterate that the best anyone can do is identify potential turning points and look to time entries and exits that fit their trading style, risk appetite, and goals.

With that in mind, let’s discuss the potential turning points for natural gas at today’s $2.263 swing low and at $2.11, the latter of which I think is the most likely point for a bottom to be made.

December’s wave structure down from $3.391 has unfolded in a five-wave pattern. We are not Elliott Wave fanatics or strict practitioners, but when a textbook pattern forms we pay attention.

Below are some of the basic Elliott Wave rules we abide by and look for when a five-wave pattern forms.

Basic Elliot Wave Rules, according to Kase:

  • A five-wave pattern is made up of three impulse waves and two corrective waves
  • Two of the three impulse waves should be equal in size
  • The impulse waves, labeled I, III, and V, should break down into five sub-waves.
  • Wave III cannot be the smallest impulse wave
  • Waves I, III, and IV should be proportional to one another (0.618, 1.00, 1.382, 1.618, etc.)

For the five-wave pattern down from $3.391 wave I met its 1.618 projection at $2.607 (end of wave III) and trend terminus (2.9693/3.3912) at $2.263 (potential end of wave V). The lowest that wave I projects is $2.12 as the 2.764 extension.

NGZ5 20151028

Given the importance of $2.263, the ticks up after the close, and oversold conditions on the KasePO, KaseCD, and slow stochastic, prices might turn higher from this level.

However, at this point there are not two equal waves. At $2.36 waves I and V were equal, but prices fell to $2.263. At $2.10 waves III and V will be equal. Therefore, based upon the basic Elliott Wave Rules, December will likely fall to the confluence point of $2.11 where wave I will have met its 2.764 projection and waves III and V will be equal.

From $2.11 we would expect to see a three-wave correction, and because of the time of year, a significant rally as the market heads into the winter heating season. A sustainable rally will be confirmed by a KasePO PeakOut, KaseCD KCDpeak, and %K over %D crossover as momentum rises out of oversold territory on the slow stochastic.

There are no guarantees that $2.11 will hold over the course of the longer-term, but this has become the most likely point at which a bottom will be made.

This is a brief natural gas forecast ahead of tomorrow’s EIA report. Our weekly Natural Gas Commentary is a much more detailed and thorough analysis. If you are interested in learning more, please sign up for a complimentary four week trial.

By Dean Rogers

This is the time of year when everyone is looking for a bottom and pre-winter rally for natural gas. The logic and seasonal timing make sense, but picking bottoms is a dangerous game. Those that successfully time the bottom are more lucky than good. The best that most mere mortals can hope for is to be prepared for the turn so that they can react in an effective manner that fits their goals, strategy, and risk appetite.

This is why it is important to have a forecast and directional opinion (and yes, sideways is a direction) about the market in addition to a set of reliable indicators like Kase StatWare or KaseX to time entries and exits. The forecast is the framework for the market that lets you know where key support and resistance are and when you can expect correction and potential trend reversal. Indicators tell you when to get in, where to place stops, and when to get out.

For instance, $2.40 was major support for November natural gas. This was a highly confluent target, and we had discussed this level as a potential stalling point for many weeks (even months) leading up to the decline to $2.403 on October 2. However, the subsequent move up was shallow, choppy, and corrective. Long trades could have been taken on shorter bar lengths during the corrective move up, but in our detailed weekly forecasts and mid-week blog updates we anticipated another decline and test of $2.40 because the market was struggling to overcome key resistance levels at $2.48 and $2.59.

November fell to $2.41 on October 16 and started to bounce again. The move stalled at $2.50 on Tuesday, October 20 and prices fell to new lows for November and the winter contracts on Wednesday, October 21.

NGX5 20151021

$2.40 has held so far on a closing basis, but a sustained close below this level will open the way for at least $2.33, the 1.00 projection for the wave $2.578 – 2.41 – 2.499 and very likely $2.27. The latter is a confluent objective for the waves down from $2.859, $2.72, and $2.578 making it the next potential point at which a bottom could be made.

Most technical factors are negative and there is little evidence that the decline is going to stall. However, the importance of support at $2.33 and especially $2.27 indicate that we should be prepared for at least another correction and a potential bottom soon. Keep a close eye on your indicators to tell you when to time your entries and watch for closes above key resistance levels to confirm the move down has ended.

For now, initial resistance is $2.45 and key resistance, for the near term, is $2.50.

This is a brief natural gas forecast ahead of tomorrow’s EIA report. Our weekly Natural Gas Commentary is a much more detailed and thorough analysis. If you are interested in learning more, please sign up for a complimentary four week trial.