Technical Factors Call for Natural Gas Prices to Test $2.89

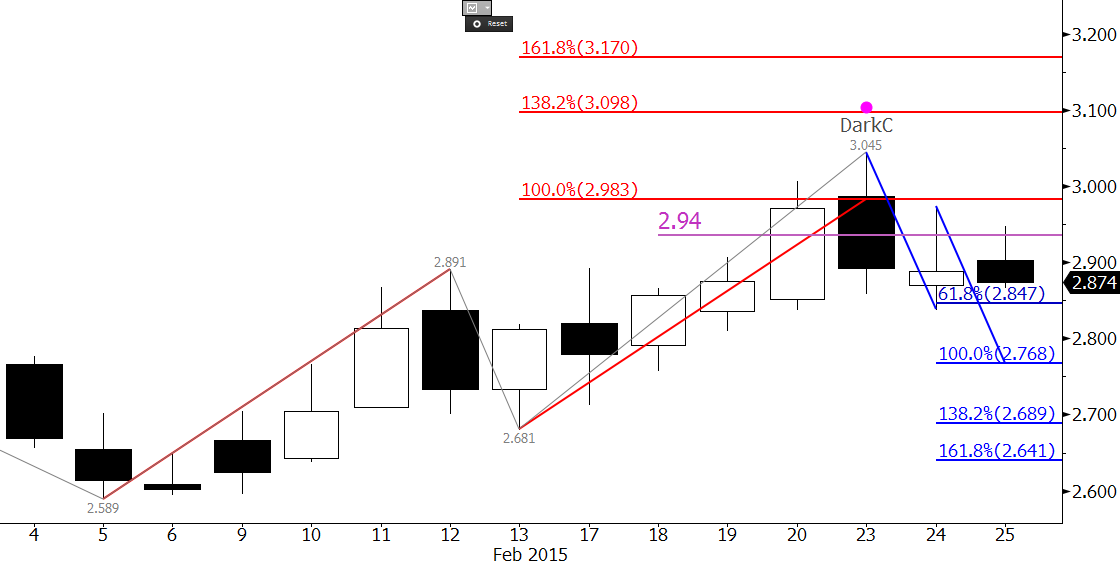
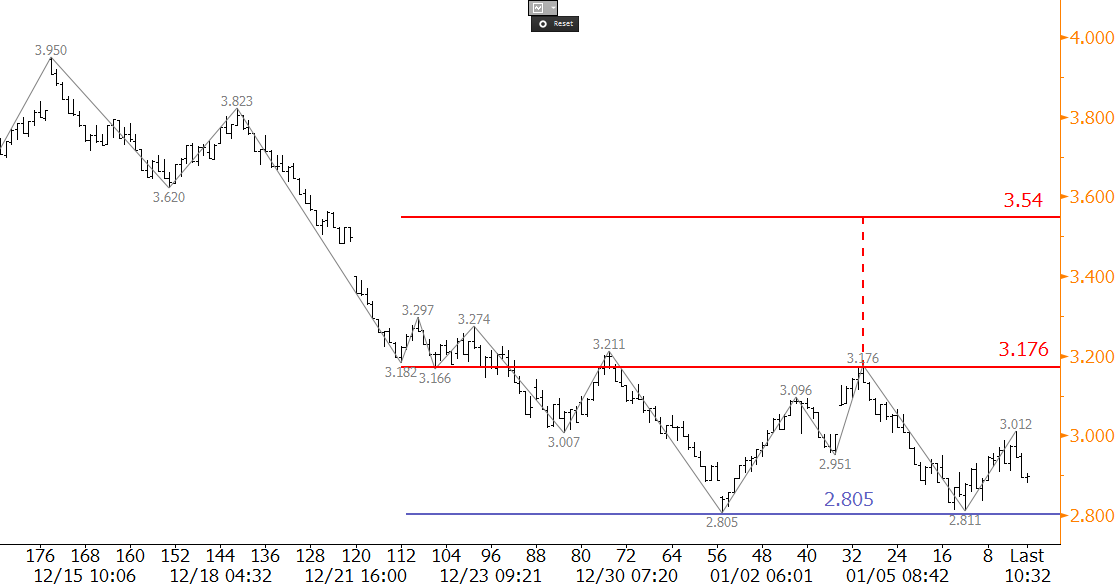
Natural gas prices are still oscillating in the corrective range between approximately $2.60 and $3.00. Early in the week it looked as though natural gas prices were ready to continue the decline. However, while there is little doubt that the long-term bias is negative, Wednesday’s price rise has called into questions how soon natural gas prices will fall to new contract lows.

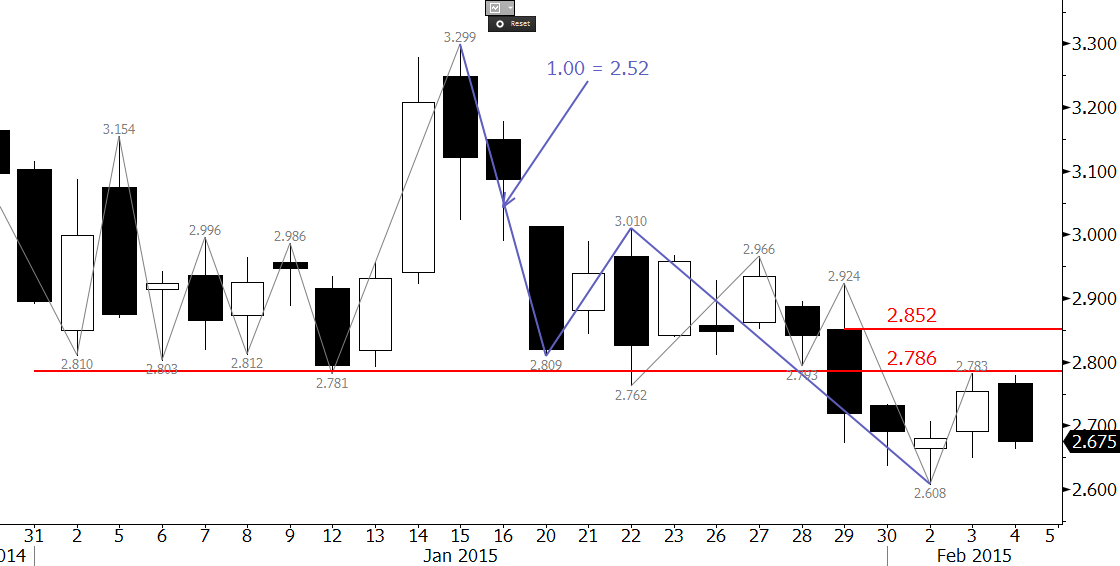
Monday’s gap from $2.783 was filled early Wednesday and then April futures overcame the 0.618 projection at $2.80 for the wave up from $2.641. The $2.80 level was also near the 62 percent retracement of the decline from $2.87 to $2.662. The confluence of the wave projection and retracement at $2.80 makes it a crucial decision point for the near term outlook. Should natural gas prices close over $2.80, look for at least $2.89 because it is the 1.00 projection. This level is most important because it is also the 62 percent retracement from $3.045 to $2.641, the 0.618 projection for the wave up from $2.589 (not shown), and is in line with last weeks $2.87 swing high. A close over $2.89 would open the way for an extended correction and would further delay a decline to new contract lows.

natural gas prices

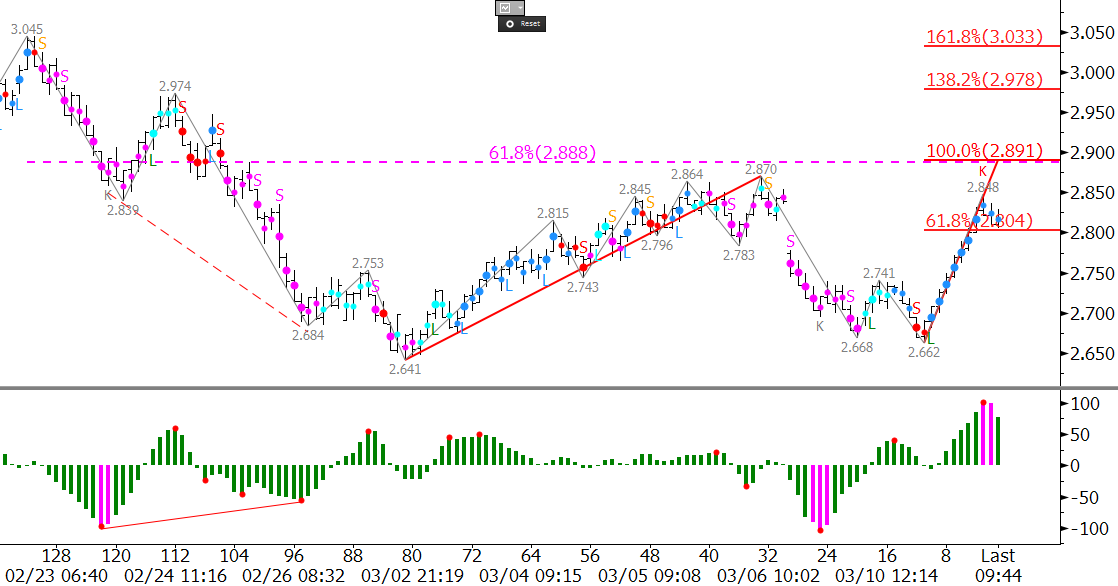
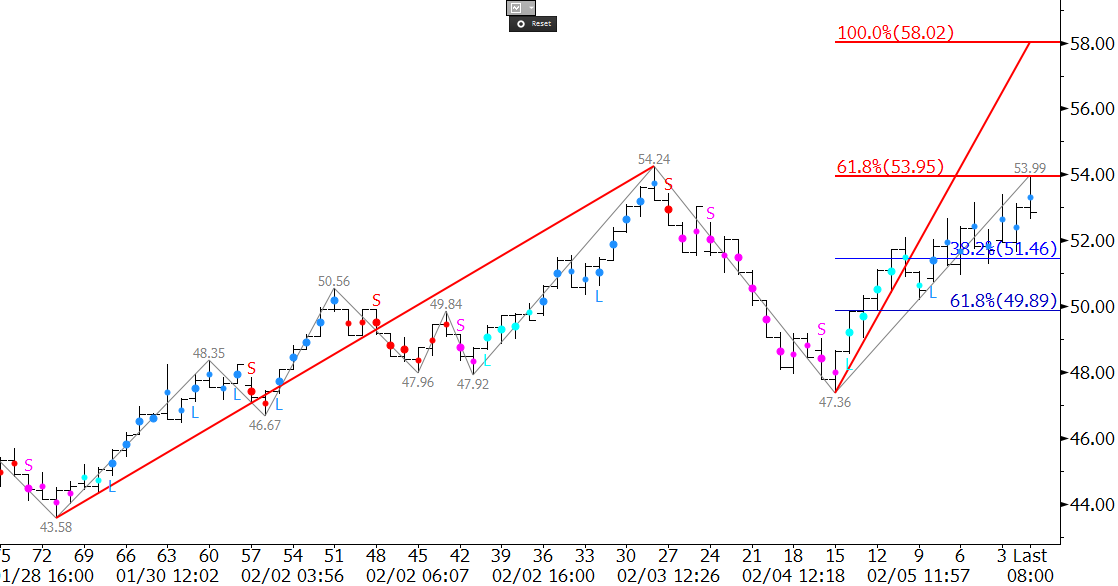
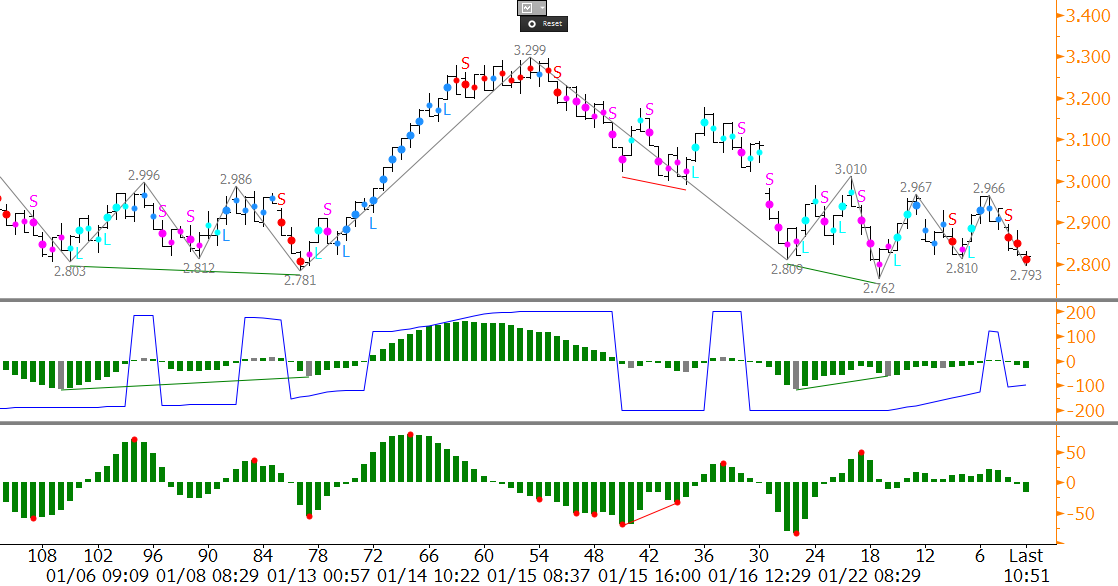
The first class long permissions (blue dots) for the Kase Easy Entry System (KEES) indicate the move up will likely continue, and that $2.89 should at least be tested tomorrow. However, the bearish KCDpeak (red K above 2.848) indicates the move up is already overbought on the 120-minute equivalent Kase Bar chart. A move above $2.848 would negate the KCDpeak, and as long as the KEES permissions remain long (blue dots) the near-term bias will remain positive.

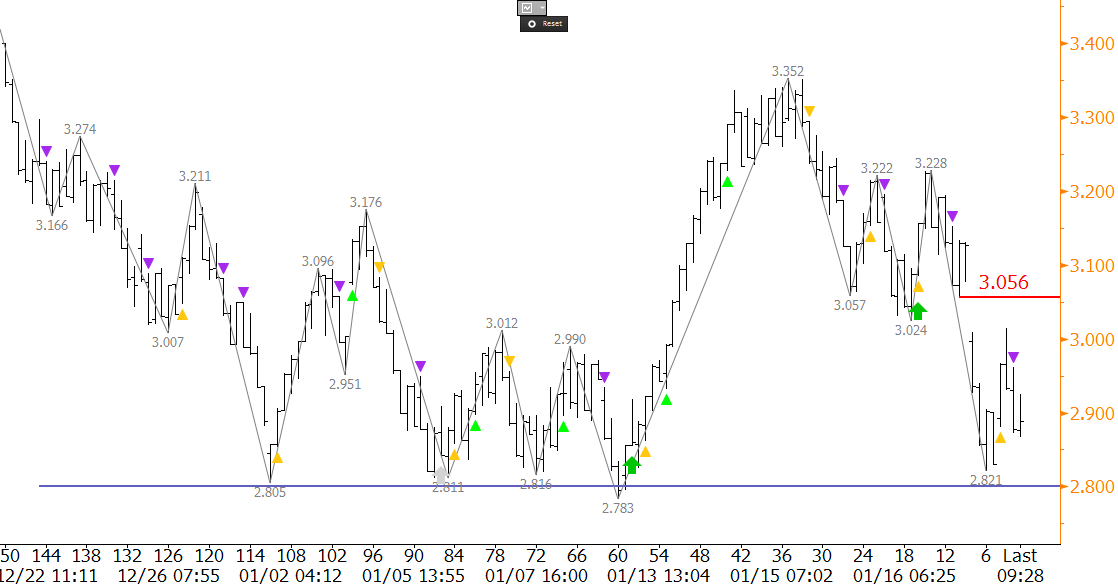
Look for support at $2.73. A close below this over the next few days would shift the near-term bias back to negative and call for the $2.641 swing low to be challenged.

Learn more information about Kase’s energy price forecasts.
Learn more about KEES, which is part of Kase StatWare.

Since late 2011 the Korean Stock Exchange (KOSPI) has oscillated in a narrowing range, now nearing its apex, which means a breakout is expected within the next quarter or two, perhaps sooner.

The pattern began after 2011’s decline to 1644.11. The entire pattern could be the middle “B” wave of a downward ABC correction, or, alternatively the first wave of a renewed push higher. This will remain an open question until there’s a break out, but recent technicals call for a test the formation’s upper trend line. So odds may indeed favor a break higher.

KOSPI Monthly
KOSPI Forecast Monthly

The first positive factor is a bullish piercing pattern that formed after a test of the pennant’s lower trend line, when January opened below December’s close and closed above December’s midpoint. If February, now trading slightly over December’s 1971.95 open, closes above that point, the bullish tone will be confirmed.

The next bullish factor for this KOSPI forecast can be seen on the daily chart, in red. This is a five-wave trending pattern that met a major target at 1970.27 (the top of Wave 3), and is now poised to extend to key endpoint targets for Wave 5, at 2039.6. Early in the move up a strong buy signal called a pierced dart (two green up arrows and yellow triangle) triggered on the KaseX trading study.

KOSPI Daily
KOSPI Forecast Daily

Hitting 2039.6 would be extremely important because the KOSPI Index would have overcome the top of Wave B, marked in blue. To be considered complete, waves must extend to at least their 0.618, or smaller than, projection. This value was met at 1876.27. Kase’s studies show that just 13 percent of waves stall at this level, the remainder go on to meet their equal to, or 1.0 projection. Overcoming 1994.82 would wipe out Wave C. At that point, the entire wave down from 2093.08 would have to extend down as a whole. Alternatively the wave would be considered complete at the minimum extension, potentially a bearish technical failure.

A bearish failure often results in a sharp rise. Therefore, overcoming 1994.82 could be the catalyst that the KOSPI Index needs to make a decisive upward move.

2039.6 has about 2/3rds odds to be met, and would likely trigger connections to 2158.2 from the waves up from 1644.11. At that point, the resistance line will have been broken. Waves up from 892.16, which also point to 2158.2, might then extend to higher targets at 2336.2 and 2484.3.

In summary, while KOSPI has been oscillating in a neutral range, 2039.6 is the key for an upside test. There could be a pullback at 2039.6, but a sustained close over this, calls for 2158.2, above the upper trend line. A sustained close over this would confirm a valid break higher and open the way for the 2336.2 and 2484.3 targets.

Learn more about Kase’s trading indicators KaseX and Kase StatWare that were used for this KOSPI forecast.

Take a trial of Kase’s weekly energy forecasts that use the same techniques as this KOSPI forecast.

Natural gas’s recent upward correction has been driven by cold weather, and still has a modest chance to extend. However, the key question that should be asked is how long will natural gas prices be able to sustain upward momentum once weather moderates? Several technical factors are already showing that the move up may be over, and that a continued decline may take place sooner than some might have expected.

The move up stalled at $3.045 on Monday morning. From a technical standpoint, this was a bit disappointing because the wave $2.589 – 2.891 – 2.681, which had previously met it 1.00 projection, failed to meet its 1.382 target at $3.098. This was especially negative because Monday’s decline and close below Friday’s $2.91 midpoint triggered a bearish Dark Cloud Cover (marked by the Kase Candles indicator’s pink dot and DarkC label). Dark cloud covers are reversal patterns, and the formation would be confirmed upon a close below Friday’s $2.852 open.

Natural Gas Prices

Subsequently, the attempted moves up on Tuesday and Wednesday have failed to close over the $2.94 midpoint of Monday. A close over $2.94 would negate the dark cloud cover, and open the way for another attempt at $3.098 and $3.17, the 1.382 and 1.618 targets for the primary wave up from $2.589, respectively. However, the failure to close over $2.94, so far at least, is negative.

The key for the down move will be a close below $2.85. As previously stated, $2.85 is the confirmation point for the dark cloud cover. It is also the 0.618 projection for the wave $3.045 – 2.839 – 2.974. Therefore, a close below $2.85 would call for at least $2.77. In our detailed weekly price forecast, $2.77 was pegged as the major decision point for a continued decline and retest of the $2.589 contract low. As shown by the blue wave extensions, at minimum, a close below $2.77 should clear the way for the 1.618 projection at $2.64.

Unless there is a shock from tomorrow’s U.S. Energy Information Administration (EIA) Natural Gas Weekly Update, it looks as though the move up has stalled, and that major test of support at $2.77 will take place in the next few days. The near-term outlook for natural gas prices is not yet technically bearish, but a sustained close below $2.77 will help to shift the bias strongly in that direction.

Take a trial of Kase’s Weekly Natural Gas Price Forecast.

WTI crude oil is trying desperately to show that a bottom has been made and that a recovery is underway. WTI is testing a crucial decision point at $54.0. This is the 0.618 projection for the wave, $43.58 – 54.24 – 47.36. Most waves that meet the 0.618 projection extend to at least the 1.00 projection, in this case, $58.0. However, a pullback will usually take place first.

Support at $49.9 should hold, but the $47.36 swing low is the level that must hold for the near-term outlook to remain positive. A close below this would negate the wave up from $43.58, and call for a continued decline.

Take a free four week trial of Kase Energy Price Forecasts.

CLH5

For several weeks $2.79 was major support for natural gas. This level was tested many times, and was finally broken after last week’s bearish U.S. Energy Information Administration (EIA) Natural Gas Weekly Update.

Subsequently, prices have fallen to a $2.608 contract low, and $2.79 has become near-term resistance. The $2.79 level is the completion point for a bullish morning star setup, and was tested on Tuesday when prices rose to $2.783. This level is expected to hold for at least the next few days.

NGH5

As of this analysis, Wednesday’s decline has setup a pseudo bearish engulfing line. The bearish engulfing line and other technical factors indicate another bearish EIA number may be expected tomorrow.

Trading will likely be extremely choppy over the next few days, but look for $2.79 to hold and for prices to challenge the $2.608 swing low. Ultimately, the decline is expected to extend to the next major target and bearish decision point at $2.52.

Conversely, a close over $2.79 in the next few days would complete the bullish morning star setup and open the way for an extended correction to the $2.852 confirmation point.

For more information about Kase StatWare please visit the Trading Indicators Page. To take a free trial of Kase’s weekly energy forecasts please visit the Energy Price Forecasts Page.

NY Harbor ULSD future’s upward correction extended to 177.7 on Monday. The primary wave 158.9 – 171.7 – 160.5, met its 1.382 projection at 177.7 and is poised to extend to the 1.618 projection of 184.2. This is the decision point for an extended correction and potential recovery. Although it is too early to say that a bottom has been made, a sustained close over 184.2 would open the way for 198.7 and 217.7. A close below 164.3 would indicate the upward correction is complete and call for 153.2 and lower.

To learn more about Kase’s forecasts please visit the Energy Price Forecasts Page.

HO


Natural gas has positioned itself for a break out of the recent coiling pattern that began forming on January 20. March futures tested the crucial $2.79 area this morning, and most technical factors still favor continued decline. However, March’s inability to close below $2.79 is making this recent range look more like a short-term bottoming formation versus a corrective pattern. In addition, a bullish KasePO divergence and first class long permissions (blue dots) for the KEES indicator on the 240-minute equivalent Kase Bar chart indicate prices may attempt to rise above $3.01 again after tomorrow’s U.S. Energy Information Administration (EIA) Natural Gas Weekly Update.

NGH15

The key for a break higher will be a close over $2.97. This is the 0.618 projection for the wave $2.762 – 3.957 – 2.81. March already stalled at this level once, but overcoming $2.97 would open the way for $3.01, which then connects to $3.08 as the 1.382 projection. The $3.08 level is also near the top of the window that took place between January 16 and 20, so a close over this in coming days would be bullish for the near-term outlook.

That said, even though March has held $2.79 on a closing basis thus far, it has not been able to maintain momentum behind any recent price rise. If natural gas cannot break higher this week, the odds of an extended upward correction will quickly diminish. A close below $2.79 would then open the way for the next leg down, where the first target of that move is $2.71.


Last week’s natural gas price rise was poised to fill December 22nd’s gap from $3.48, but the upward correction stalled at $3.352. The week settled above the $3.09 midpoint of Wednesday, January 12th’s candlestick, leading to speculation that the market might try to rise again early this week. However, Monday’s intraday gap down from $3.056 and settle back below $3.00 was negative for the near-term outlook.

There is still major support at $2.80 that has held so far, but after this morning’s move up stalled and failed to fill to $3.056 gap it looks as though a bearish U.S. Energy Information Administration (EIA) Natural Gas Weekly Update is expected tomorrow.

The key wave for the short-term is $3.352 – 3.024 – 3.228. This wave has already fallen below its 1.00 projection at $2.90 and is poised to meet at least its 1.382 projection at $2.77. This then connects to $2.66 as the 1.618 projection. The $2.66 target is highly confluent for many of the larger and earlier waves down, and is the 0.618 projection for the wave $3.95 – 2.783 – 3.352. The confluence is important because a sustained close below $2.63 would open the way for a decline into the mid-to-low $2’s over the course of the longer-term. Therefore, $2.63 is a potential stalling point for the decline.

nat gas

The KaseX indicator on the 240-minute equivalent Kase Bar (KBAR) also confirms the negative outlook and has generated several short signals (purple arrows) during the decline from $3.352. The most recent short signal came after the $3.015 swing high this morning. At this point, there are no warning signals that indicate profit should be taken or that short trades should be exited. This will likely change though should prices recover above the $3.015 swing high.

First resistance ahead of the EIA report is $3.06, which is near the top of the $3.056 gap. A move above this would call for 3.15, which is the 0.618 projection for the wave $2.783 – 3.352 – 2.821. The $3.15 level is confirmed as the 62 percent retracement from $3.352 to $2.821. It is also interesting to note that this morning’s rise to $3.015 stalled just below the 38 percent retracement at $3.02. This is another negative factor.

To summarize, the bias is negative, and the move down is expected to continue. There is strong support at $2.80, but a move below this would call for at least $2.77 and very likely $2.66. Resistance at $3.06 will likely hold, but a move above that would open the way for at least $3.15.

For more information about KaseX please visit our Trading Indicators Page. To take a trial of Kase’s in-depth weekly energy forecasts on natural gas and crude oil please visit the Energy Forecasts Page.


The outlook for natural gas is negative, and without help from external factors the decline will likely continue. However, the market is hesitant to break support at $2.80 in the near-term, and is likely waiting on tomorrow’s U.S. Energy Information Administration (EIA) Natural Gas Weekly Update before it presses higher or continues to decline.

Several positive technical factors indicate resistance will likely be tested before tomorrow’s EIA report. A small intraday double bottom formed at $2.805, as shown on the 120-minute equivalent Kase Bar chart. The confirmation point for the double bottom is $3.176, which is in line with the 1.00 projection for the wave $2.805 – 3.176 – 2.811. Immediate resistance is $3.04, the 0.618 projection. A move above $3.04 would call for $3.176 to be challenged, and a close over $3.176 would confirm the double bottom. This would then open the way for an extended correction to targets between $3.18 and the double bottom’s $3.54 target (calculation is 3.176 + (3.176 – 2.805) = 3.537). A move of this magnitude will not likely take place without major support from bullish external factors.

NGG

Should $3.176 hold, the move down will likely extend. First support is $2.89, and a close below this would call for a key target at $2.79. This is the 0.618 projection for the wave $3.176 – 2.811 – 3.012. A close below $2.79 would negate the double bottom and open the way for targets in the mid $2s.

Overall, the outlook is negative, and the move down is still favored. However, the double bottom, a daily morning star setup, and deeply oversold conditions, all indicate that a correction may take place very soon, and could be spurred by tomorrow’s EIA report.

Visit the Kase Energy Forecasts Page to sign up for a free trial of Kase’s weekly energy forecasts on natural gas and crude oil.