S&P 500 Will Break Out Of Pennant, But Which Direction?

SPXby Dean Rogers

Read on TraderPlanet.com

You can feel it in the air, the mounting anticipation of an interest rate hike is coming to a head as investors, traders, and even my own feisty grandmother are jockeying for position ahead of this week’s Fed meeting.

Some pundits believe a rate hike at this time would be disastrous and that Tuesday’s S&P 500 gain of 1.3 percent was a sign the markets are telling the Fed to wait. Others believe the rate hike is long overdue and that the sooner the Fed raises rates the better.

There is a lot of indecision about what the Fed will do this week. However, one thing is for certain, whether Feds hike rates or not, the market’s direction for at least the next few weeks, and possibly months, will be determined within the next 48 hours.

What Do The Technical Factors Say?

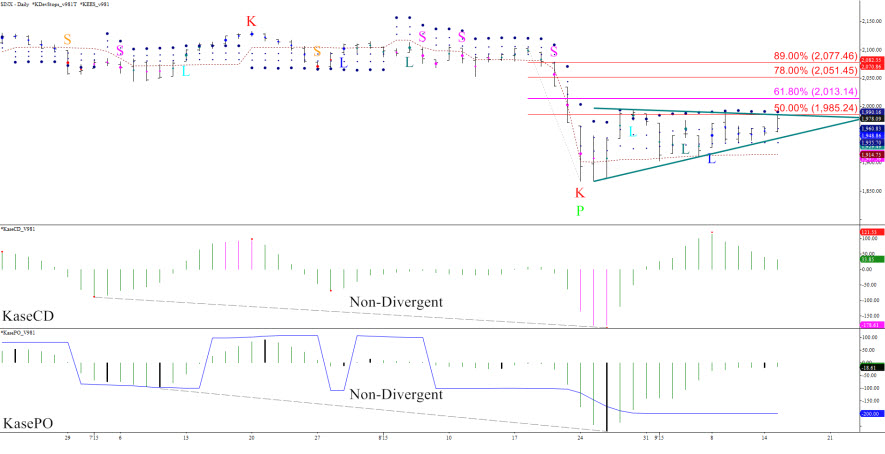
The formation of a pennant reflects the market’s indecision. The pattern is bearish because it formed after the decline to 1867.01 on August 24. That said, there are enough bullish factors to indicate this formation has a higher than normal probability to fail.

SPX-Fig1Charts created using TradeStation. ©TradeStation Technologies, Inc. 2001-2015. All rights reserved. No investment or trading advice, recommendation or opinions are being given or intended.

Bearish Technical Factors

  • Pennant
  • Move up from 1867.01 stalled near the 50 percent retracement of the decline from 2103.47
  • Held Kase’s daily DevStop3 (large blue dot)
  • Decline to 1867.01 was non-divergent

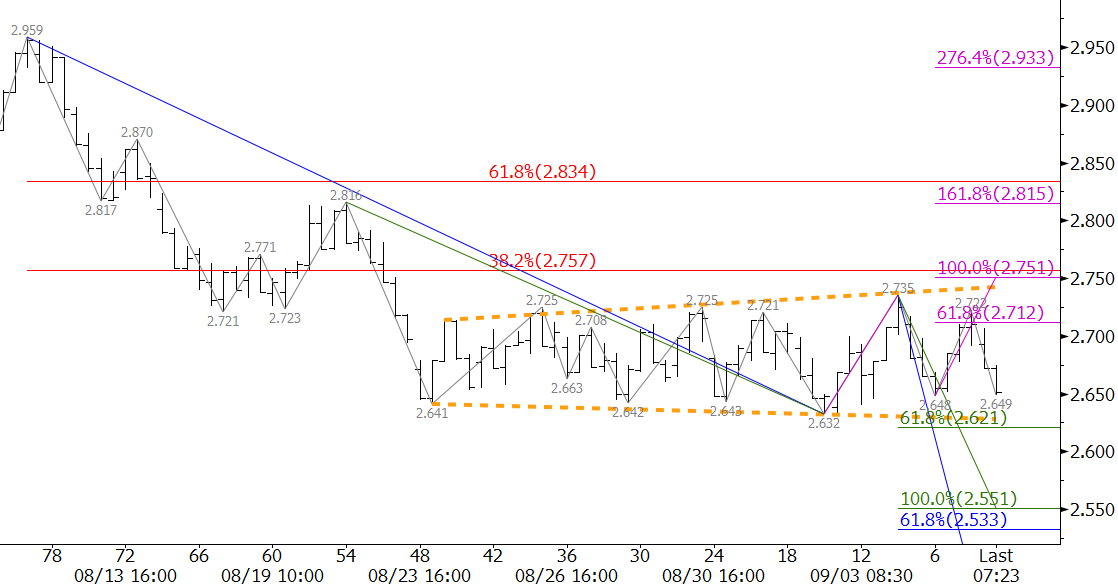
The bottom of the pennant is near 1950 and a close below this would open the way for 1903. This then connects to confluent wave projections at 1838, 1732, 1665, and 1567. Upon a break lower out of the pennant we expect to see at least 1838 and very possibly 1732.

The lowest target at 1567 is interesting because it is near the 38 percent retracement from the March 2009 swing low of 666.79 to the recent 2134.72 swing high. In addition, 1567 is near the October 2007 high of 1576.09, just before the financial crisis, and the March 2000 high of 1552.87, just before the dotcom crash.

I am not calling for 1567 yet, but from a longer-term perspective, a decline to 1567 would be a normal technical correction (38 percent), and a 25 percent correction from high to low (less than half of the financial crisis’s decline).

Bullish Technical Factors

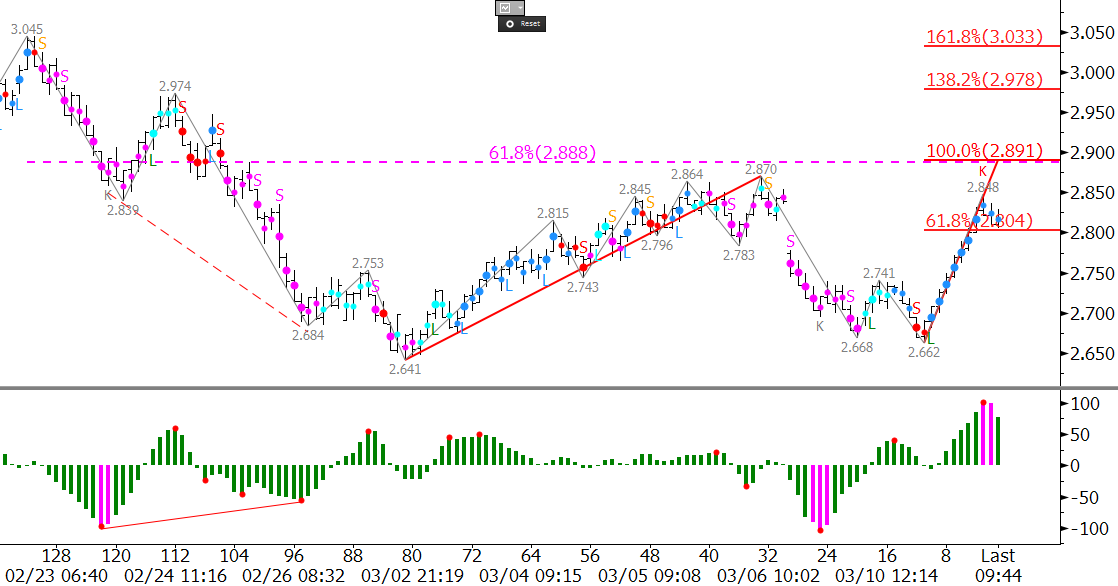
  • KCDpeak and PeakOut (oversold signals)
  • KEES buy signals (blue L’s) and long permissions (blue dots)

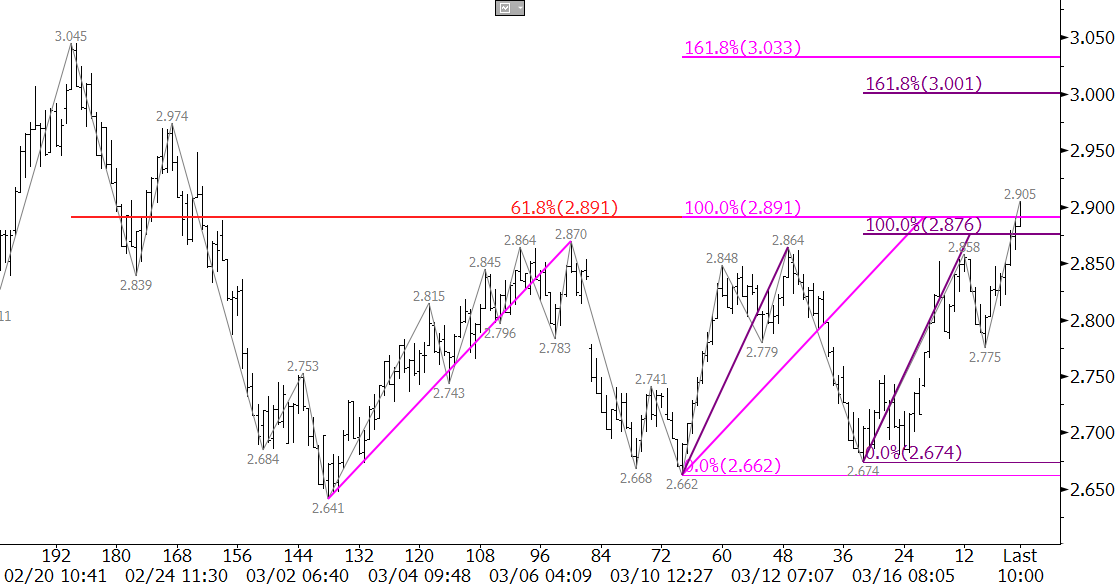
A close over 1985 would confirm the bearish pennant has failed and open the way for at least 2022, the 1.00 projection for the wave 1867.01 – 1993.48 – 1903.07. Then connects to confluent projections at 2070 and 2109 as the 1.382 and 1.618 projections, respectively. The latter is the last level protecting the 2134.72 high.

Conclusions

It is a very tough call and the market could break either way. On balance though, I see enough bearish evidence to state that I think the Fed will hike rates and the markets will break lower.

Now if you’ll excuse me, I need to call to my grandmother and tell her not to bet the farm on the downside. Maybe some puts are in order.

“Ask Kase” and your question may be chosen as the subject of a future column (askkase@kaseco.com).

Send questions for next week to askkase@kaseco.com, and click the link learn more about the KasePO, KaseCD, KEES, and the Kase DevStops.

By Dean Rogers

Natural gas had oscillated in an expanding triangle since August 24. Monday’s break higher out of the pattern was positive, but stalled at $2.794, the 50 percent retracement from $2.959 to $2.632.

The move to $2.794 was healthy because the decline had become stale. The rally gave bears a new opportunity to short the market.

Tuesday’s close below Monday’s $2.73 midpoint formed a daily dark cloud cover (bearish), and Wednesday’s close below $2.70 confirmed the pattern. This is also in line with the 62 percent retracement from $2.632 to $2.794.

natural gas

Caution is warranted and trading will likely remain choppy, but the bearish technical factors indicate another test of $2.63 is expected. A close below this would open the way for the decline to $2.55 and lower have expected for several weeks.

This is a brief natural gas forecast ahead of tomorrow’s EIA report. Our weekly Natural Gas Commentary is a much more detailed and thorough analysis. If you are interested in learning more, please sign up for a complimentary four week trial.

WTI crude oil rose for a second straight day due to the declining dollar. The long-term bias is still negative, so the move up is corrective. However, mixed fundamental and technical factors indicate the correction should extend to at least $48.2 before settling into another trading range. This is the 1.00 projection for the wave up from $44.03 and the 38 percent retracement of the decline from $54.0. A close over $48.2 would call for $50.4, the 1.618 projection and the 62 percent retracement. Look for immediate support at the $45.33 and $44.77 swing lows.

Take a trial of Kase’s weekly energy forecasts.

WTI Crude Oil

During the calendar month of March the April natural gas futures contract has traded in a range bound between $2.64 and $2.87. Most fundamental and technical factors are still negative for the long-term. The move up at this point is still corrective and will only delay the inevitable decline that is ultimately coming. However, late winter weather concerns continue to support the market and have rattled the nerves of traders enough over the past two days to push natural prices above $2.87 to challenge key resistance at $2.89 ahead of tomorrow’s U.S. Energy Information Administration (EIA) Natural Gas Weekly Update.

The market is hinting that a bullish EIA update may be expected, but if the number is disappointing, this natural gas price rise will collapse in upon itself and could be the catalyst the finally push prices lower to challenge key support targets.

The wave formations up from $2.589 (not shown), $2.641, $2.662, and $2.674 all show that $2.89 is a confluent wave projection. It is also the 62 percent retracement from $3.045 to $2.641. The confluence of wave projections and retracements at $2.89 make it the key decision point for an extended correction to at least $3.00 and possibly $3.07. At the time of this analysis, natural gas prices are trading right at $2.89, but they will need to settle above this to open the way for $3.00 in early trading tomorrow before the EIA update is released. Unless the EIA report is extremely bullish, it is doubtful that prices will settle above $3.07 in coming days.

natural gas forecast

Look for support at $2.78. This is in line with the $2.775 swing low, the midpoint of the recent range between $2.64 and $2.87, and the midpoint of the March 12 and 17 candlesticks. A close below $2.78 would indicate the move up has failed to extend once again.

Take a trial of Kase’s in-depth weekly energy price forecasts.

Natural gas prices are still oscillating in the corrective range between approximately $2.60 and $3.00. Early in the week it looked as though natural gas prices were ready to continue the decline. However, while there is little doubt that the long-term bias is negative, Wednesday’s price rise has called into questions how soon natural gas prices will fall to new contract lows.

Monday’s gap from $2.783 was filled early Wednesday and then April futures overcame the 0.618 projection at $2.80 for the wave up from $2.641. The $2.80 level was also near the 62 percent retracement of the decline from $2.87 to $2.662. The confluence of the wave projection and retracement at $2.80 makes it a crucial decision point for the near term outlook. Should natural gas prices close over $2.80, look for at least $2.89 because it is the 1.00 projection. This level is most important because it is also the 62 percent retracement from $3.045 to $2.641, the 0.618 projection for the wave up from $2.589 (not shown), and is in line with last weeks $2.87 swing high. A close over $2.89 would open the way for an extended correction and would further delay a decline to new contract lows.

natural gas prices

The first class long permissions (blue dots) for the Kase Easy Entry System (KEES) indicate the move up will likely continue, and that $2.89 should at least be tested tomorrow. However, the bearish KCDpeak (red K above 2.848) indicates the move up is already overbought on the 120-minute equivalent Kase Bar chart. A move above $2.848 would negate the KCDpeak, and as long as the KEES permissions remain long (blue dots) the near-term bias will remain positive.

Look for support at $2.73. A close below this over the next few days would shift the near-term bias back to negative and call for the $2.641 swing low to be challenged.

Learn more information about Kase’s energy price forecasts.
Learn more about KEES, which is part of Kase StatWare.

April gasoline prices fell for the fourth day in a row, but held support at 185.0. The bearish KaseCD divergence and underlying short permissions (red dots) indicate the decline should continue to 180.0. A normal correction will hold 180.0 because it is the 38 percent retracement of the move up from 149.64 and the 1.618 projection for the intraday wave down from 198.93 (not shown). A close below 180.0 would call for the 62 percent retracement at 168.5. This level must hold for gasoline prices to retain any chance at a continued recovery in the near term.

Learn more about Kase’s energy forecasts.

gasoline prices

Cold weather continues to support natural gas, but the wide sweeping frigid conditions have not been enough of an influence to drive prices higher. Fundamental and technical factors leave little doubt that the outlook for the next several months is bearish, but for now, natural gas prices are stuck in a trading range bound between approximately $2.55 and $3.00.

Prices fell last week after the disappointing U.S. Energy Information Administration (EIA) Natural Gas Weekly Update, and a swing low of $2.641 was made on Tuesday. The $2.80 midpoint of last Thursday’s candlestick held Wednesday morning, which may be an early indication that another disappointing EIA update is expected tomorrow. The $2.80 level is confluent resistance because it is also the 38 percent retracement of the decline from $3.045 to $2.641.

There are a few short term positive factors (green arrow and triangle) triggered by KaseX on the $0.05 KaseBar chart, and a close over $2.80 would open the way for key resistance at $2.90. The $2.90 level is the 62 percent retracement from $3.045 and the 0.618 projection for the wave $2.589 – 3.045 – 2.641. This is crucial, because waves that overcome the 0.618 projection typically extend to at least the 1.00 projection, in this case $3.10. We expect $2.90 to hold, but a close over this level would shift near term odds in favor of another attempt at $3.10 and higher.

Natural Gas Forecast

First support is $2.70, and a move below this would call for the $2.641 swing low and $2.589 contract lows to be challenged. The most important target is still $2.55, because the technical show that it is the gateway objective for a decline into the low $2s. It will likely be at least a few more weeks before prices close below $2.55.

So for now, our analysis leads us to believe that a near term test of resistance at $2.80 and possibly $2.90 will take place, but that $2.90 will hold and prices will continue to oscillate in a sideways range.

Kase Bars are available on TradeStation and Bloomberg.

Take a trial of Kase’s in-depth weekly Natural Gas Forecast or of KaseX.

Natural gas’s recent upward correction has been driven by cold weather, and still has a modest chance to extend. However, the key question that should be asked is how long will natural gas prices be able to sustain upward momentum once weather moderates? Several technical factors are already showing that the move up may be over, and that a continued decline may take place sooner than some might have expected.

The move up stalled at $3.045 on Monday morning. From a technical standpoint, this was a bit disappointing because the wave $2.589 – 2.891 – 2.681, which had previously met it 1.00 projection, failed to meet its 1.382 target at $3.098. This was especially negative because Monday’s decline and close below Friday’s $2.91 midpoint triggered a bearish Dark Cloud Cover (marked by the Kase Candles indicator’s pink dot and DarkC label). Dark cloud covers are reversal patterns, and the formation would be confirmed upon a close below Friday’s $2.852 open.

Natural Gas Prices

Subsequently, the attempted moves up on Tuesday and Wednesday have failed to close over the $2.94 midpoint of Monday. A close over $2.94 would negate the dark cloud cover, and open the way for another attempt at $3.098 and $3.17, the 1.382 and 1.618 targets for the primary wave up from $2.589, respectively. However, the failure to close over $2.94, so far at least, is negative.

The key for the down move will be a close below $2.85. As previously stated, $2.85 is the confirmation point for the dark cloud cover. It is also the 0.618 projection for the wave $3.045 – 2.839 – 2.974. Therefore, a close below $2.85 would call for at least $2.77. In our detailed weekly price forecast, $2.77 was pegged as the major decision point for a continued decline and retest of the $2.589 contract low. As shown by the blue wave extensions, at minimum, a close below $2.77 should clear the way for the 1.618 projection at $2.64.

Unless there is a shock from tomorrow’s U.S. Energy Information Administration (EIA) Natural Gas Weekly Update, it looks as though the move up has stalled, and that major test of support at $2.77 will take place in the next few days. The near-term outlook for natural gas prices is not yet technically bearish, but a sustained close below $2.77 will help to shift the bias strongly in that direction.

Take a trial of Kase’s Weekly Natural Gas Price Forecast.

Most technical factors now indicate that WTI’s upward correction has failed and that the near term WTI price outlook is negative again. Monday’s decline broke the lower trend line of a bullish ascending wedge. Formations like this break higher around 75 percent of the time, so failures like this do not generally bode well for a continued price rise.

More importantly, WTI prices are about to take out the crucial $48.2 swing low. This level is important because it is the 1.00 projection for the wave $55.05 – 48.2 – 54.92, the 62 percent retracement from $44.37 to $55.05, and the key swing low for the upward wave formation from $44.37. Taking out $48.2 would call for at least $45.5, and very likely to $43.8 and lower.

The only real hope for a continued WTI price rally in the near term would be for prices to hold $48.2. Look for resistance at $51.0 and $52.5. A close over $52.5 would call for another test of the triple top of $55.0.

For a more in-depth analysis, take a free trial of Kase’s weekly crude oil price forecast.

wti price


WTI crude oil is trying desperately to show that a bottom has been made and that a recovery is underway. WTI is testing a crucial decision point at $54.0. This is the 0.618 projection for the wave, $43.58 – 54.24 – 47.36. Most waves that meet the 0.618 projection extend to at least the 1.00 projection, in this case, $58.0. However, a pullback will usually take place first.

Support at $49.9 should hold, but the $47.36 swing low is the level that must hold for the near-term outlook to remain positive. A close below this would negate the wave up from $43.58, and call for a continued decline.

Take a free four week trial of Kase Energy Price Forecasts.

CLH5