Crude Oil Short-Term Forecast – March 6, 2018

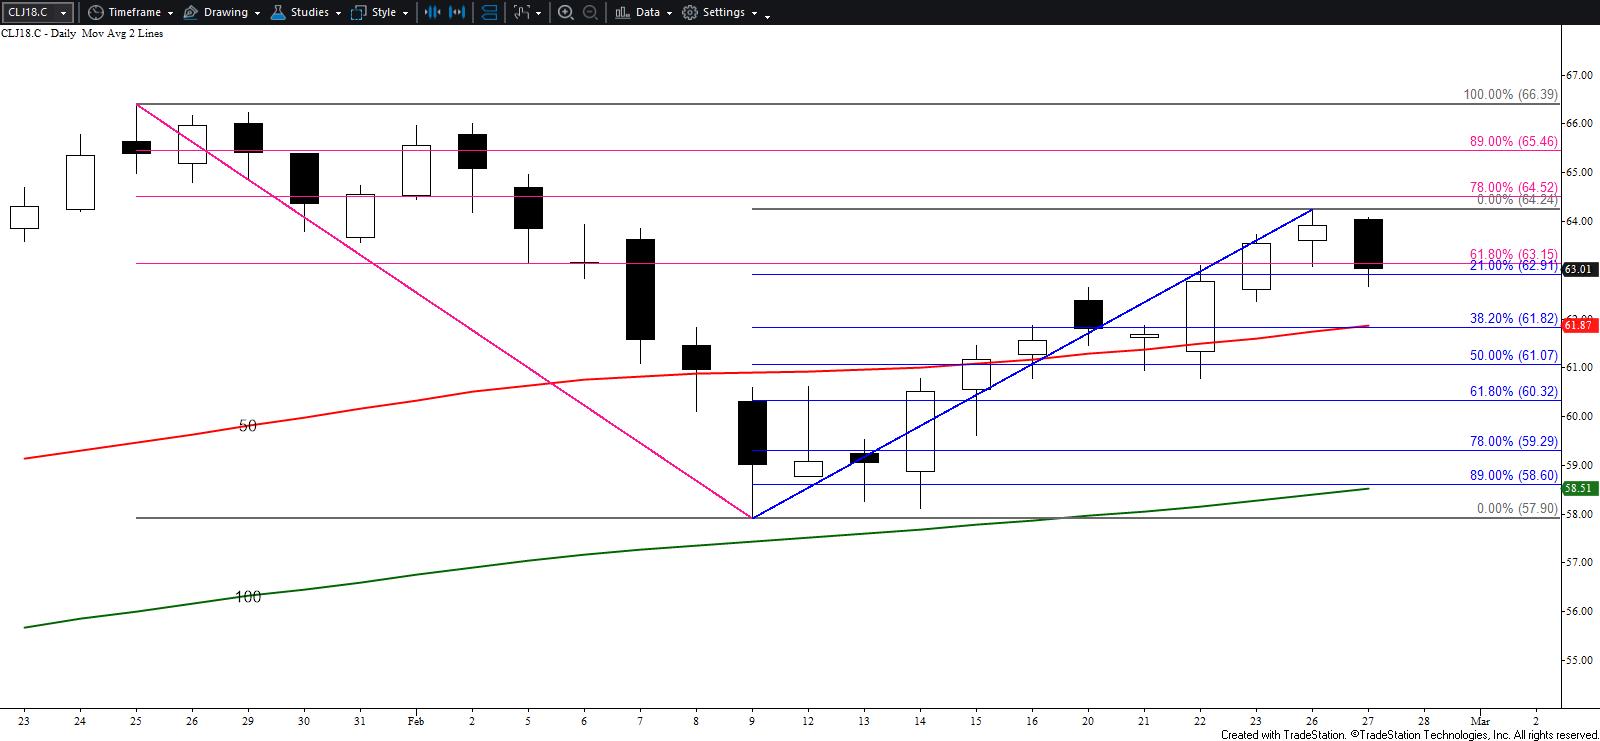
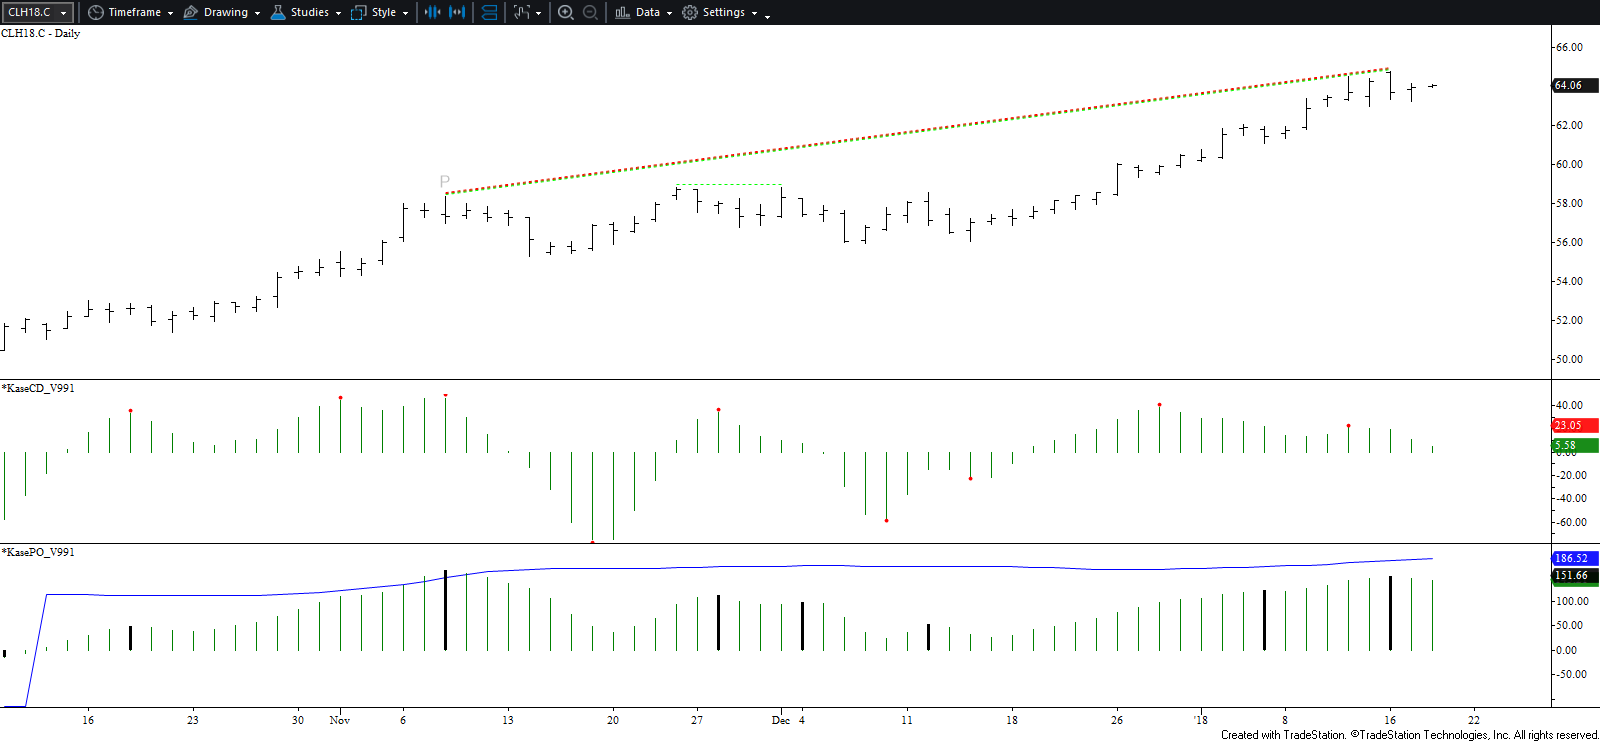
The long-term outlook remains slightly negative for WTI crude oil, but the near-term outlook seems to switch from positive to negative on a day-to-day basis. This generally reflects a market that is unsure of itself and could indicate a trading range is forming. For now, though, given today’s failure to settle above the equal to (1.00) target of the wave $60.13 – 61.97 – 61.1 and the 62 percent retracement of the decline from $64.24, odds have shifted in favor of testing support tomorrow.

The formation of a daily shooting star setup and wave formation down from $63.28 call for $62.0 and possibly $61.6 tomorrow. These are targets for the small wave down from $63.28 and the shooting star’s completion and confirmation points. A close below $62.0 would open the way for $61.1 and $60.7. The latter is most important because it is the smaller than target of the wave $64.24 – 60.13 – 63.28 and connects to $59.2 and lower.

April WTI Crude Oil - 0.35 Kase Bar
April WTI Crude Oil – 0.35 Kase Bar

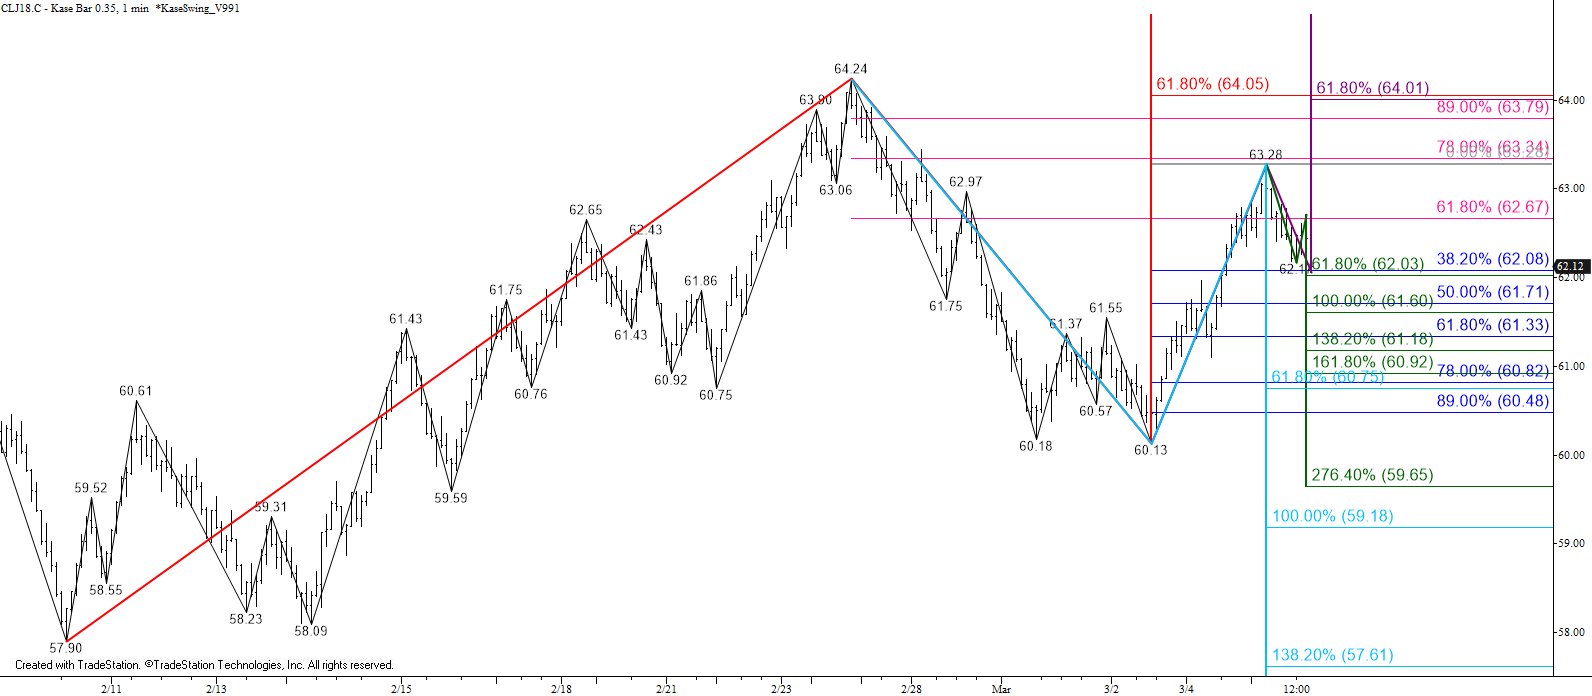
Initial resistance at $63.0 should hold, but the key level for the near-term is $63.5. A close above this would call for $64.1, the smaller than target of the wave up from $57.9. This level is the key to a bullish outlook because a close above $64.0 would shift long-term odds in favor of a continued rise to $66.5 and higher.

This is a brief analysis for the next day or so. Our weekly Crude Oil Commentary and daily updates are much more detailed and thorough energy price forecasts that cover WTI, Brent, RBOB Gasoline, Diesel, and spreads. If you are interested in learning more, please sign up for a complimentary four-week trial.

WTI crude oil’s settle below Friday’s $63.1 midpoint and the daily bearish engulfing line is negative for tomorrow’s outlook.

There is immediate support at Friday’s $62.6 open, but the small wave formation down from $64.24 calls for at least $62.3 and likely $61.9. The latter is most crucial for the near-term because it is the 50-day moving average, the 38 percent retracement of the move up from $57.9, and is near last Thursday’s $62.1 midpoint.

April WTI Crude Oil - Daily
April WTI Crude Oil – Daily

A close below $61.9 would open the way for a test of key support at $60.3. This is the 62 percent retracement of the move up from $57.9 and is near calendar January’s open. Settling below $60.3 would shift long-term odds back in favor of a continued decline.

That said, the move down is probably corrective of the move up from $57.9. Today’s $63.5 midpoint and $64.1 open are initial resistance. $63.5 should hold but $64.1 is key. A close above this would call for tests of $64.5 and $65.5, the last levels protecting the $66.39 high.

This is a brief analysis for the next day or so. Our weekly Crude Oil Commentary and daily updates are much more detailed and thorough energy price forecasts that cover WTI, Brent, RBOB Gasoline, Diesel, and spreads. If you are interested in learning more, please sign up for a complimentary four-week trial.

April WTI crude oil’s move up from $57.9 is most likely corrective of the decline from $66.39 and may be complete. Important resistance was met at $62.65, a bearish intra-day KaseCD divergence was confirmed, and the subsequent move down is poised to extend. Trading over the next few days should indicate whether the upward correction is complete.

Today, the larger than (1.618) target of the wave $57.9 – 60.61 – 58.09 was met at $62.65. The subsequent wave down, $62.65 – 61.43 – 62.43 has fallen below its smaller than (0.618) target and is now poised to reach at least the $61.2 equal to (1.00) target tomorrow. A close below this would open the way for $60.7, $60.3, and $59.7. Key support for the near-term is $59.7, the 62 percent retracement of the move up from $57.9. Settling below this would put odds strongly back in favor of a continued decline.

April WTI Crude Oil - 0.50 Kase Bar
April WTI Crude Oil – 0.50 Kase Bar

For the move up to continue, support at $59.7 must hold and prices will have to ultimately overcome $63.2, the 62 percent retracement of the decline from $66.39. Tomorrow, look for first resistance at $62.1 and key resistance at $62.6. A close above $62.6 would call for a test of $63.2.

This is a brief analysis for the next day or so. Our weekly Crude Oil Commentary and daily updates are much more detailed and thorough energy price forecasts that cover WTI, Brent, RBOB Gasoline, Diesel, and spreads. If you are interested in learning more, please sign up for a complimentary four-week trial.

Outlook for WTI

March WTI crude oil’s formation of a second daily star (in this case a hammer), confirmed daily KCDpeak, oversold Stochastic, and failure to break the $58.07 swing low are all factors that indicate the upward correction from $58.07 still has a reasonable chance of extending before the decline continues. However, unless WTI settles above at least $59.8 and more likely $60.4 to confirm the morning star setup (made up of the aforementioned stars) odds will continue to favor a decline.

March WTI Crude Oil
March WTI Crude Oil

Initial support is the $58.39 swing low, and an early move below this tomorrow will call for $58.0, the smaller than (0.618) target of the wave $60.83 – 58.39 – 59.49. This is a key objective because it is the lowest that the initial wave down from $66.66 projection and is the 38 percent retracement of the move up from this past summer’s $43.91 swing low. Settling below $58.0 will open the way for $57.6 and very likely $57.1, the equal to (1.00) target of the wave down from $60.83.

Should the upward correction attempt to extend again tomorrow, look for initial resistance at last Friday’s $59.8 midpoint. This is the completion point of the morning star setup, a close above which would call for the $60.4 confirmation point. The $60.4 level is key for the near-term because it is also sitting just above the smaller than target of the wave up from $58.07. Settling above $60.4 would call for a likely move above the $60.83 swing high to $61.4, which is in-line with the equal to target of the wave up from $58.07 and the 38 percent retracement of the decline from $66.66.

This is a brief analysis for the next day or so. Our weekly Crude Oil Commentary and daily updates are much more detailed and thorough energy price forecasts that cover WTI, Brent, RBOB Gasoline, Diesel, and spreads. If you are interested in learning more, please sign up for a complimentary four-week trial.

Outlook for WTI

WTI crude oil’s decline wiped out yesterday’s bullish morning star setup and fulfilled the $61.5 larger than (1.618) target of the wave $66.66 – 63.67 – 66.3. If the move down from $66.66 proves to be a three-wave correction the $61.25 swing low should hold. However, as of this afternoon, there is no definitive evidence this will be the case (though an upward correction might take place first as discussed below).

Odds favor a continued decline and a close below $61.2 will open the way for $60.8, $60.2, and $59.3. The next major objective is $58.0, the trend terminus and XC (2.764) projection of the aforementioned wave down from $66.66.

March WTI Crude Oil - Daily
March WTI Crude Oil – Daily

That said, there is a reasonable chance the move down from $66.66 will transmute into a five-wave formation that just completed Wave III at $61.25. If this is the case, then an upward correction to form Wave IV should take place first. Today’s $62.9 midpoint is expected to hold, but the key level is today’s $63.9 open. A close over this would be an early indication that the corrective move down may be complete.

Outlook for Brent

Brent crude oil fulfilled the $65.2 larger than (1.618) target of the wave $70.78 – 67.81 – 70.02 when prices fell to $65.16 today. This is a potential stalling point, but there is no definitive technical evidence that indicates the move down will stall.

If the move down from $70.78 is a three-wave correction of the larger scale move up, then $65.16 should hold. However, this is doubtful because Brent has settled below the $65.6 smaller than (0.618) target of the sub-wave $70.02 – 66.53 – 67.72. This means that this wave should extend to at least its $64.2 equal to target. A close below $64.9 would open the way for $64.2, which then connects to $63.0 and $62.0. The $62.0 target is the next major objective because it is the trend terminus and XC (2.764) projection of the wave down from $70.78 and the larger than target of the wave down from $70.02.

With all of that said, there is a chance the wave down from $70.78 is Wave I of a five-wave pattern that completed Wave III at $65.16. In this case, an upward correction to form Wave IV should take place first. Today’s $66.4 midpoint is expected to hold upon such a correction. Key resistance is today’s $67.2 open.

This is a brief analysis for the next day or so. Our weekly Crude Oil Commentary and daily updates are much more detailed and thorough energy price forecasts that cover WTI, Brent, RBOB Gasoline, Diesel, and spreads. If you are interested in learning more, please sign up for a complimentary four-week trial.

WTI Crude Oil Forecast

March WTI crude oil confirmed bearish daily KasePO and KaseCD weak divergences. A weak divergence is one that forms when the confirming bar closes in the opposite direction of the signal, in this case, up. Weak divergences generally do not follow through as well as normal divergences but do warrant caution. In addition, yesterday’s midpoint held, leaving the daily dark cloud cover reversal pattern intact.

Tomorrow odds favor a continued decline to at least $63.2. This is the smaller than (0.618) target of the wave $64.83 – 63.25 – 64.14 and connects to $62.5 as the equal to (1.00) target. Settling below $62.5 would open the way for a larger pullback to $62.0 and even $61.6, the intermediate (1.382) and larger than (1.618) targets for the wave down from $64.83.

WTI Crude Oil Daily Chart

Should prices rise a bit higher first, look for $64.4 resistance to hold. A move above this would call for a new high of $65.1, a highly confluent and key threshold that connects to $66.3 and higher.

Natural Gas Forecast

February natural gas a crucial target at $3.29 when it rose to $3.288 today. This is an extremely important area for natural gas because $3.29 is in line with the equal to (1.00) projection of the wave $2.562 – 3.097 – 2.746, the 62 percent retracement of the decline from $3.772, and the 200-day moving average. A sustained close above $3.29 would confirm the market’s bullish sentiment, opening the way for a larger scale move up to $3.49 and possibly higher over the next few weeks.

That said, given the importance of $3.29 caution is warranted. This is a potential area in which the move up could stall and another sizable correction take place. In addition, the KaseCD, MACD, and Slow Stochastic are set up for bearish daily divergence.

Natural Gas Daily Chart

If prices are going to overcome $3.29 this week $3.18 should hold. Key support for the next few days is $3.13, today’s open and the 62 percent retracement of the move up from $3.039. A close below this would not doom the move up but would open the way for a more substantial correction to challenge support at $3.08 and even $3.01.

This is a brief analysis for the next day or so. Our weekly Crude Oil and Natural Gas Commentaries and daily updates are much more detailed and thorough energy price forecasts that cover key futures contracts, calendar spreads, and ETFs. If you are interested in learning more, please sign up for a complimentary four-week trial.

The long-term outlook for WTI crude oil remains bullish and any move down will most likely be corrective. However, the move up has reached an area of significant resistance between $57.2 and $60.0 for the December contract. Many of the largest waves up from this summer’s $43.08 swing low project to targets within this range. There are no factors that indicate the move up will end, but the confluence of resistance within this range, overbought daily and weekly momentum, and the formation of a daily bearish Harami line and star indicate a corrective pullback should take place as early as tomorrow.

WTI Crude Oil Daily Candlesticks and Wave Projections

The late move below the $56.89 swing low opens the way for at least $56.6. This is the Harami line and star’s completion point and equal to (1.00) target of the wave $57.69 – 56.89 – 57.44. A move below this would call for $56.1, the star’s confirmation point and the larger than (1.618) target of the wave down from $57.69. For now, $56.1 will probably hold, but settling below this would shift odds in favor of a larger downward correction to $55.2 and possibly $54.7 before the move up continues toward $60.0.

For today’s small move down to continue the $57.44 swing high must hold. A move above this would take out the wave down from $57.69 that projects to $56.6 and lower. This would also call for a test of $58.1. A close above $58.1 would put near-term odds back in favor of $58.5 and $59.0. Both are important projections for the waves up from $46.59 and $43.08, respectively.

This is a brief analysis for the next day or so. Our weekly Crude Oil Commentary and daily updates are much more detailed and thorough energy price forecasts that cover WTI, Brent, RBOB Gasoline, Diesel, and spreads. If you are interested in learning more, please sign up for a complimentary four-week trial.

December WTI crude oil had a legitimate chance for the corrective move down from $54.46 to extend today after setting up a daily evening star and intraday head and shoulders formation. However, support held, and prices rose at the end of the day, settling above the key $54.2 target and opening the way for $55.0 and higher tomorrow.

The next major confluence point is $56.0, the equal to (1.00) target of the wave $46.59 – 53.11 – 49.44, and the larger than (1.618) target of the wave $49.44 – 52.65 – 50.87. Small pullbacks will likely take place before $56.0 is met. Once this objective is overcome look for $56.4 and likely $57.2, the intermediate (1.382) target of the wave $43.08 – 50.72 – 46.59.

WTI Crude Oil
WTI Crude Oil

Resistance at $54.2 has now become support that will likely hold tomorrow. A move below this would call for $53.8 and possibly $53.4, last Friday’s midpoint. Settling below $53.4 is unlikely over the next few days but would indicate a larger correction is underway before the move up continues to $56.0 and possibly higher.

This is a brief analysis for the next day or so. Our weekly Crude Oil Commentary and daily updates are much more detailed and thorough energy price forecasts that cover WTI, Brent, RBOB Gasoline, Diesel, and spreads. If you are interested in learning more, please sign up for a complimentary four-week trial.

WTI crude oil met support at $51.3 before stalling at $51.21. The move down has been choppy and forms a bullish wedge on the $0.35 Kase Bar chart. The move up from $51.21 was aggressive and is poised to break higher out of the wedge and challenge key resistance at $52.5 again tomorrow. A close above this would open the way for $53.0, $53.5, and ultimately $54.2, the next major objective.

WTI Crude Oil $0.35 Kase Bars

That said, prices pulled back a bit this afternoon, therefore a test of $51.4 might take place first, but support is expected to hold. A move below $51.4 before $52.5 is met would call for $51.1 and possibly $50.3. The near-term outlook becomes negative again upon a close below $50.3, the 62 percent retracement of the move up from $49.1 and the 1.618 projection of the wave $52.37 – 51.21 – 52.17.

This is a brief analysis for the next day or so. Our weekly Crude Oil Commentary and daily updates are much more detailed and thorough energy price forecasts that cover WTI, Brent, RBOB Gasoline, Diesel, and spreads. If you are interested in learning more, please sign up for a complimentary four-week trial.

Many near-term factors are positive for WTI crude oil. Tuesday’s move up confirmed a daily morning star, today’s move settled above the $51.22 swing high, and last week’s $50.5 midpoint has been overcome. These factors call for the move up to continue, but caution is warranted.

WTI met and held the exact 62 percent retracement of the decline from $58.26 to $49.1 when it rose to $51.42 today. This crucial level held again when prices rose to $51.37 ahead of the close.

WTI Crude Oil Kase Bars
WTI Crude Oil $0.35 Kase Bars

Therefore, prices will probably test support at $50.6 before challenging $51.4 again. Key support is $50.1, Tuesday’s midpoint and the 62 percent retracement of the rise from $49.1 to $51.42. A close below this would indicate the move up has failed and that the near-term has readopted a negative outlook.

Should prices settle above $51.4, look for a $52.1 and more likely $52.5 to be met before the end of the week.

This is a brief analysis for the next day or so. Our weekly Crude Oil Commentary and daily updates are much more detailed and thorough energy price forecasts that cover WTI, Brent, RBOB Gasoline, Diesel, and spreads. If you are interested in learning more, please sign up for a complimentary four-week trial.