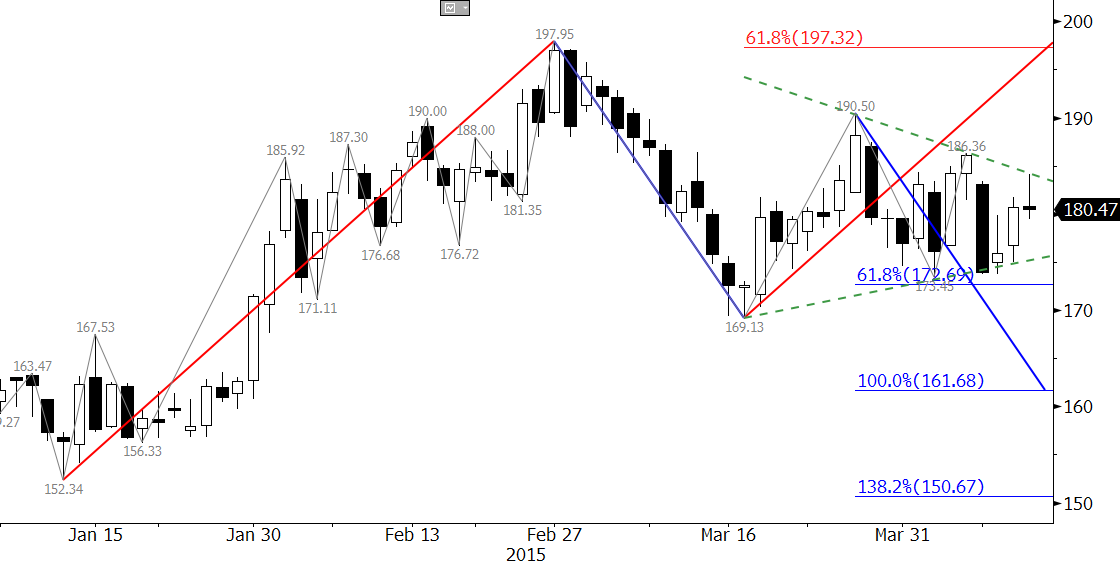
Since mid-March prices for the May RBOB Gasoline futures contract have oscillated in a narrowing range and formed a coil pattern. Coils are patterns that indicate market indecisiveness, which has definitely been the case for the entire crude oil infrastructure since the beginning of the year. Coils are not as reliable as flags, pennants, and wedges at predicting the direction of the breakout, coils do tend to break in the direction of the trend, in this case down.

On Monday, the upper trend line of the coil was tested and held. Prices fell at the end of the day, and the evening star setup that formed indicates a test of support and the lower trend line of the coil should be tested later this week.
A close below 172.7, the 0.618 projection of the wave down from 197.95 would open the way for at least 161.7 and possibly 150.7 as he 1.00 and 1.382 projections, respectively.
A close over 185.0 would indicate prices have broken higher out of the coil and call for another test of crucial resistance at 197.3, which is the 0.618 projection of the wave up from 152.34.
Learn more about Kase’s weekly energy forecasts.

