Crude Oil Forecast: WTI Overcomes $48.38 Swing High

Bullish optimism regarding OPEC’s preliminary agreement to cut crude oil production has reportedly fueled the move higher during the past week. The news came last Wednesday after members met during a conference in Algeria. OPEC will meet again on November 30 to further discuss and possibly ratify the deal. However, many are still skeptical that an OPEC deal will be enough to balance supply and demand if production is minimally cut or capped near record output levels.

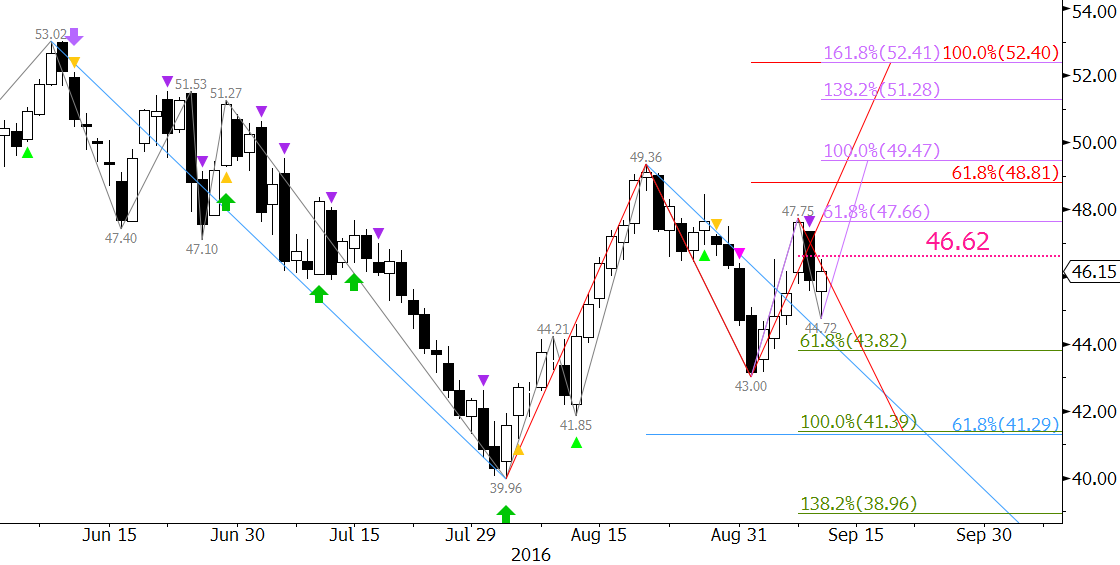
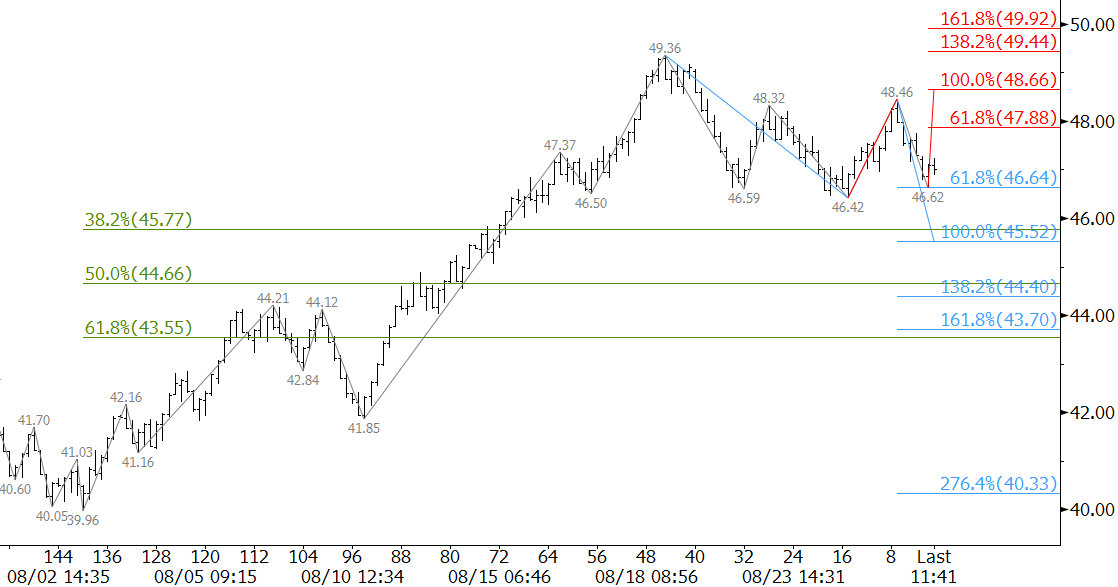
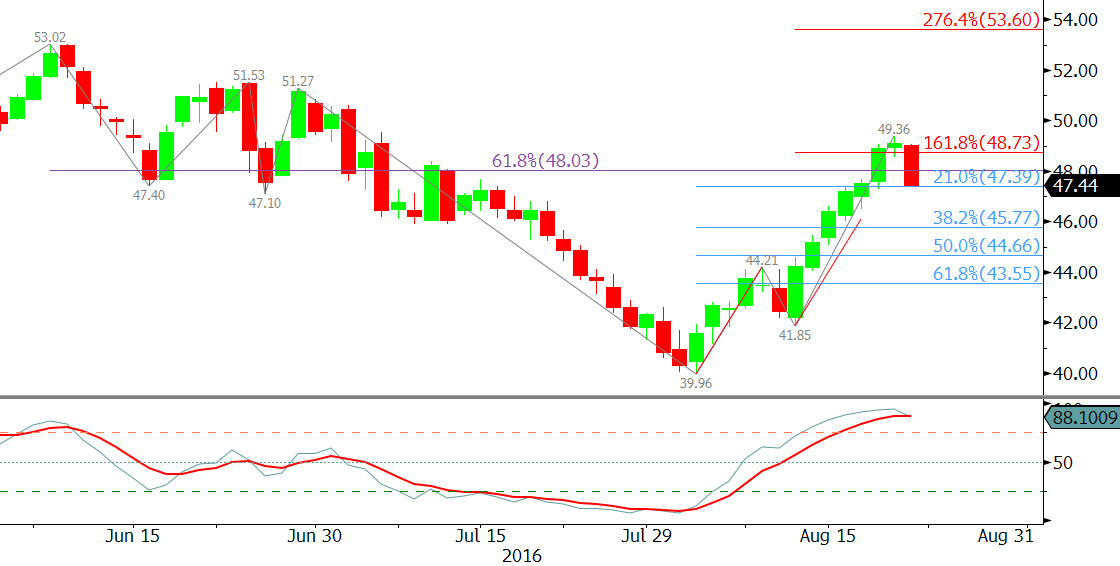
Technical factors reflect the underlying bullish sentiment. The monthly and weekly candlesticks are positive and call for the move up to extend. In addition, November WTI overcame the $48.38 swing high. This was important because the move above $48.38 takes out the primary wave down from $50.0 and significantly dampens odds for a continued decline in the near-term.

On Monday, an important target was met at $48.9. The waves that projected to $48.9 now call for November to challenge the $50.0 swing high. Overcoming $50.0 would solidify a near-term bullish outlook and call for key resistance at $52.3. The $52.3 objective is the gateway for a longer-term bullish outlook.

clx6-20161004

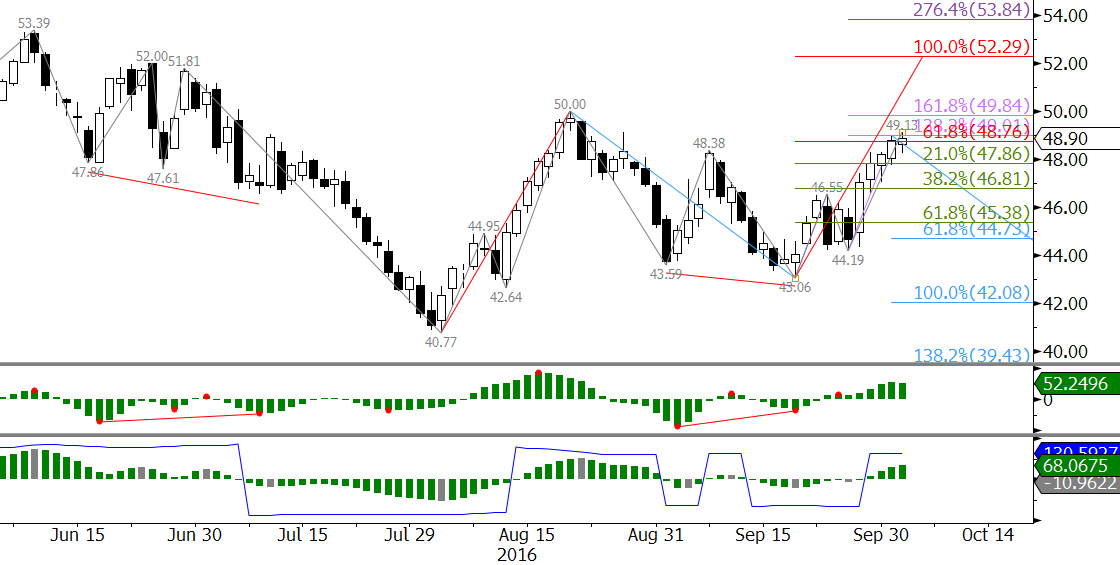
That said, bearish divergences were triggered on the $1.00 Kase Bar chart early Tuesday. Therefore, a correction might take place before the move up extends to $50.0. There is initial support at $48.0 and then $46.9. The latter is expected to hold. A close below $46.9 would call for $46.0 and then key support centered around $45.0 to possibly be tested.

This is a brief analysis and outlook for the next day or so. Our weekly Crude Oil Commentary and intra-week updates are a much more detailed and thorough energy price forecast. If you are interested in learning more, please sign up for a complimentary four-week trial.

Charts tell us what the market knows about itself, and right now, WTI crude oil is confused. There are many competing fundamental, technical, and geopolitical factors in play at the moment. Therefore, no one factor has a clear and decisive edge over the others.

October WTI is oscillating in a corrective range and will most likely continue to do so until there is a sustained close over $52.4 or below $41.3. These are the points at which the larger scale wave projections up from $39.96 and down from $53.02 merge with the most recent projections up from $43.0 and down from $49.36, respectively.

clv6-20160912

These waves also show how the connections are made to the important $52.4 resistance and $41.3 support levels.

The longer-term favors a move up, but in the near-term look for a test of at least $43.8 first. A close below this would call for $41.3. A sustained close below $41.3 is doubtful without help from external factors, but would call for a longer-term bearish outlook.

Should October WTI close over $46.6, near-term odds would shift in favor of $47.7, which is the 0.618 projection of the wave up from $43.0. This wave makes a connection from $47.7 to $49.5 and ultimately $52.4. A sustained close over $52.4 would call for the bullish move up to extend to new highs for 2016.

This is a brief analysis and outlook for the next day or so. Our weekly Crude Oil Commentary and intra-week updates are a much more detailed and thorough energy price forecast. If you are interested in learning more, please sign up for a complimentary four-week trial.

On Friday, WTI crude oil prices pulled back sharply after the U.S. Federal Reserve signaled short-term interest rates may be raised in coming weeks. The U.S. dollar rose, and oil prices fell. The week ended on a negative note, and the corrective pullback extended again on Monday.

Aside from the stronger dollar, media outlets also indicate traders and analysts are weighing the potential consequences of a still oversupplied market against the prospects of a production freeze. Last week, DOE data showed U.S. inventories of oil and refined products have risen to a record high. However, Iran has reportedly shown interest in joining talks with other major producers regarding measures to freeze production in a unified effort to stabilize prices.

The longer-term technical outlook for oil remains positive. However, near-term factors indicate the corrective decline should continue to extend first. October WTI met the 0.618 projection of the wave $49.36 – 46.42 – 48.46 on Monday. Nearly 80 percent of waves that meet the 0.618 projection extend to the 1.00 projection. Therefore, odds favor $45.5 before the move up continues.

CLV6 20160829

The $45.5 target is important because it is near the 38 percent retracement of the move up from $39.96 to $49.36. A “normal” correction should hold $45.5. A close below $45.5 would open the way for an extended correction and potential trading range in the mid-to-upper $40s.

The move down will remain choppy, but over the next few days look for resistance at $47.9 to hold. Key resistance is $48.7. A move to $48.7 would take out the wave down from $49.36 that projects to $45.5 and lower.

This is a brief analysis and outlook for the next day or so. Our weekly Crude Oil Commentary and intraweek updates are a much more detailed and thorough energy price forecast. If you are interested in learning more, please sign up for a complimentary four-week trial.

Declines in U.S. crude oil and gasoline inventories, a weaker U.S. dollar, and recent indications that OPEC and other major producers could take measures to stabilize prices are reportedly catalysts for last week’s near eight percent gain. However, some pundits believe the recent rally may keep the market oversupplied as higher prices could encourage more drilling. This point was emphasized by rig counts increasing by 10 last week to the highest level since February.

From a technical perspective, October WTI settled above key resistance levels at $48.0 and $48.7 late last week. The move up is poised to continue above $50.0, but is in desperate need of a correction. The Stochastic has been overbought, and on Friday, an evening star setup formed.

On Monday, the correction WTI has been waiting for began. Friday’s evening star was confirmed on Monday when October settled below $47.58. The Stochastic’s %K line is falling below the %D line, which is also negative. These factors indicate a deeper correction to at least $46.6 and possibly $45.8 should take place this week. The move down will likely be choppy and corrective, but should extend at least a bit more before the move up continues.

CLV6 20160822

The key support level is $45.8. This is because $45.8 is the 38 percent retracement of the move up from $39.96. A normal correction should hold $45.8. A close below this would call for an extended correction toward the 50 and 62 percent retracements.

Look for initial resistance at $48.3 and $49.0. These are near Monday’s midpoint and open. The $48.3 level will probably be tested in early trading, but should hold. A close over $49.0 would indicate the correction is complete. This would in turn open the way for $50.1 and higher.

This is a brief analysis and outlook for the next day or so. Our weekly Crude Oil Commentary and intraweek updates are a much more detailed and thorough energy price forecast. If you are interested in learning more, please sign up for a complimentary four-week trial.

September WTI crude oil’s settle above $44.4 Friday and $45.7 Monday has opened the way for the move up to continue. The Stochastic has risen into overbought territory, but there is no technical evidence the move will stall.

The next targets are $46.3, $47.0, and $47.9. The $47.9 level is a crucial confluence point split between the 62 percent retracement of the decline from $52.73 and the 1.618 projection of the wave up from $39.19. A sustained close over $47.9 would confirm the market is moving toward bullish territory again.

CLU6 20160815

A pullback may take place soon. However, support at $45.3 should hold. This is near Monday’s midpoint. Key support for the near-term is $44.7. A close below this would call for an extended downward correction to at least $44.1 and possibly $43.5.

This is a brief analysis and outlook for the next day or so. Our weekly Crude Oil Commentary and intraweek updates are a much more detailed and thorough energy price forecast. If you are interested in learning more, please sign up for a complimentary four-week trial.

September WTI crude oil’s correction up from $39.19 gained ground on Monday when it settled above $42.8. Media outlets indicate the rise was due renewed hopes that OPEC members might consider freezing production levels. OPEC announced on Monday that they would hold informal talks at an energy conference in September.

That said, from a technical perspective, the move down was due for a correction. September WTI briefly moved into bearish territory last week when it settled below $40.4. However, a highly confluent and important $39.2 target held when the $39.19 swing low was made. The Stochastic has since risen out of oversold territory, and several intraday charts confirmed bullish momentum divergences.

CLU6 20160808

Friday’s hanging man candlestick pattern was negative by Monday’s close over $42.8. This opens the way for $44.4. This is the 38 percent retracement of the decline from $52.73 to $39.19 and an important decision point for the near-term. If the move down is going to continue within the next few weeks, $44.4 should hold. However, a close over $44.4 would call for an extended correction and could be an early indication that another long-term bottom has been made.

As the move up extends over the next few days, look for near-term support at $42.5, $41.8, and $40.8. The $42.5 level will probably be tested early Tuesday, but should hold. This is near Monday’s midpoint. Key support is $40.8 because it is the 62 percent retracement of the move up from $39.19. A close below this would shift odds in favor of testing $39.19 again.

This is a brief analysis and outlook for the next day or so. Our weekly Crude Oil Commentary and intraweek updates are a much more detailed and thorough energy price forecast. If you are interested in learning more, please sign up for a complimentary four-week trial.

The U.K.’s vote for Brexit came as a shock to many investors and traders around the world. Equity markets have tumbled and crude oil followed suit as the U.S. dollar has risen substantially. Some pundits think the downturn in oil has been overdue, and warn that the market is still oversupplied and could slip further in coming weeks and months. Others hold the recovery will continue and that the decline is likely an overreaction to Brexit.

It is clear that sentiment is mixed. However, charts tell a clearer story. The long-term bias is positive, and ultimately odds still favor the move up. However, the downward correction is poised to continue for the near-term.

Negative Factors

August WTI met confluent support near $46.0 on Monday. This was in line the 0.618 projection of the wave $50.54 – 46.7 – 48.45 and 1.382 projection of the wave $48.45 – 46.92 – 47.96. Near-term odds favor a decline to at least $44.7, the 1.00 projections of the waves $52.28 – 46.4 – 50.54 and $50.54 – 46.7 – 48.45. This is a very important target and decision point for WTI. A close below $44.7 would open the way for targets in the low $40s. It is at those targets that the market will need to decide whether the move up will continue or a long-term bearish outlook would be adopted again.

CLQ6 20160627

Positive Factors

The upward correction that began late Monday afternoon may extend to $46.8 and even $47.5 in early trading Tuesday. However, $47.5 should hold. A close over $47.5 would call for a test of key resistance levels above $50.0, that if overcome, would indicate the downward correction is over.

This is a brief analysis and outlook for the next day or so. Our weekly Crude Oil Commentary is a much more detailed and thorough energy price forecast. If you are interested in learning more, please sign up for a complimentary four-week trial.

The falling U.S. dollar and higher probability the U.K. will vote to remain in the European Union are reportedly causes for crude oil’s recovery. However, some analysts have stated that increasing U.S. rig counts and production coming back online in Canada will keep a lid on oil prices for the near term.

August WTI crude oil met crucial support at $46.41 on Friday before turning higher and forming a daily bullish engulfing line. So far, the move up to $50.0 has retraced 62 percent of the decline from $52.28 to $46.4. A close over $50.0 would significantly increase odds for $51.0 and possibly $52.3 later this week.

CLQ6 20160620

Support at $48.6 will most likely hold. The key level for the next few days will be $47.8. These are the 38 and 62 percent retracements from $46.4 to $50.0, respectively. A close below $47.8 would indicate the move up has likely formed Wave B of a larger scale ABC correction. This would in turn open the way for the downward correction to extend to targets in the mid-to-low $40s.

This scenario is less likely given the strong price rise over the past few days. With all factors considered, crude oil will most likely settle into a range in the upper $40s and low $50s soon while it sorts through the conflicting geopolitical, fundamental, and technical factors.

This is a brief analysis and outlook for the next day or so. Our weekly Crude Oil Commentary is a much more detailed and thorough energy price forecast. If you are interested in learning more, please sign up for a complimentary four-week trial.

As WTI crude oil prices fall from the recent $51.67 high, some reports indicate the pullback is due to the rising U.S. dollar and increased rig counts for the second week in a row. Pundits have also stated the sharp price surge could encourage some producers to increase production, keeping the market oversupplied. Others still believe recent supply disruptions in Canada and Nigeria will be supportive.

From a technical perspective, WTI’s move up had become extended and was due for a correction. The confirmed dark cloud cover, bearish daily divergences, weekly shooting stars, and monthly evening star setups indicate the majority of technical factors are negative for the near-term.

Support at $48.6 was challenged Monday, but held on the close. A move below $48.6 in early trading Tuesday would open the way for at least $47.7 and possibly $46.7. Both targets are near major swing lows that may hold initially. Therefore, we expect the move down will be choppy as it unfolds over the next few days.

CLN6 20160613

There is a modest chance that Tuesday’s morning star setup will test Friday’s $49.8 midpoint first. This is near the 38 percent retracement of the decline from $51.67 to $48.16 and the 1.00 projection of the small wave up from $48.16. Key resistance is $50.3. This is the 62 percent retracement and 1.618 projection. Resistance at $50.3 is expected to hold. A close over $50.3 would call for prices to retest the $51.67 swing high.

This is a brief analysis and outlook for the next day or so. Our weekly Crude Oil Commentary is a much more detailed and thorough energy price forecast. If you are interested in learning more, please sign up for a complimentary four-week trial.

For the past few weeks, WTI crude oil has been trading in a tight range as it tries to sort through recent events and fundamental factors. Reports indicate Monday’s close at a 10-month high was due to concerns over continued supply disruptions and speculation that the Federal Reserve will not raise interest rates this month.

From a technical perspective, the recent wave formations show that prices are poised to rise to targets above $50.0 over the next few days before reaching the next major decision point in the mid-$50s. July WTI closed above the 0.618 projection of the wave up from $47.26 on Monday. Waves that overcome the 0.618 projection typically extend to at least the 1.00 projection, in this case $50.7. Therefore, odds favor a test of $50.7. A close over $50.7 would call for $51.8 and possibly higher this week.

CLN6 20160606

Support at $48.4 should hold. This is the 0.618 projection of the wave down from $50.21. It is also near the 62 percent retracement of the move up from $47.75 to $49.9. A close below $48.4 would call for a test of $47.5, which is near the bottom of the recent trading range. A close below this would open the way for an extended correction to $46.2 and possibly lower.

This is a brief analysis and outlook for the next day or so. Our weekly Crude Oil Commentary is a much more detailed and thorough energy price forecast. If you are interested in learning more, please sign up for a complimentary four-week trial.