WTI Crude Oil Short-Term Forecast – November 7, 2017

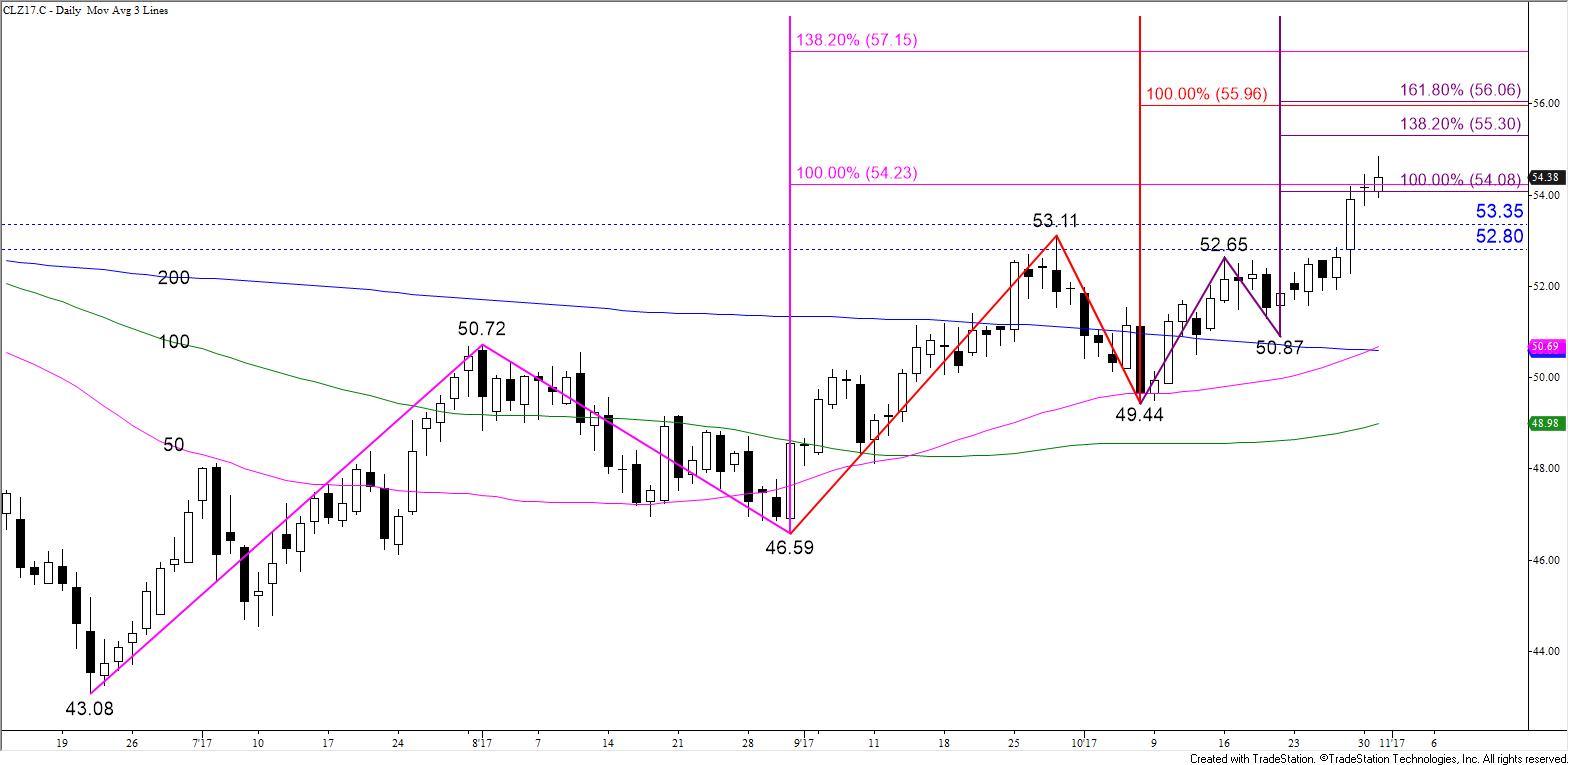
The long-term outlook for WTI crude oil remains bullish and any move down will most likely be corrective. However, the move up has reached an area of significant resistance between $57.2 and $60.0 for the December contract. Many of the largest waves up from this summer’s $43.08 swing low project to targets within this range. There are no factors that indicate the move up will end, but the confluence of resistance within this range, overbought daily and weekly momentum, and the formation of a daily bearish Harami line and star indicate a corrective pullback should take place as early as tomorrow.

WTI Crude Oil Daily Candlesticks and Wave Projections

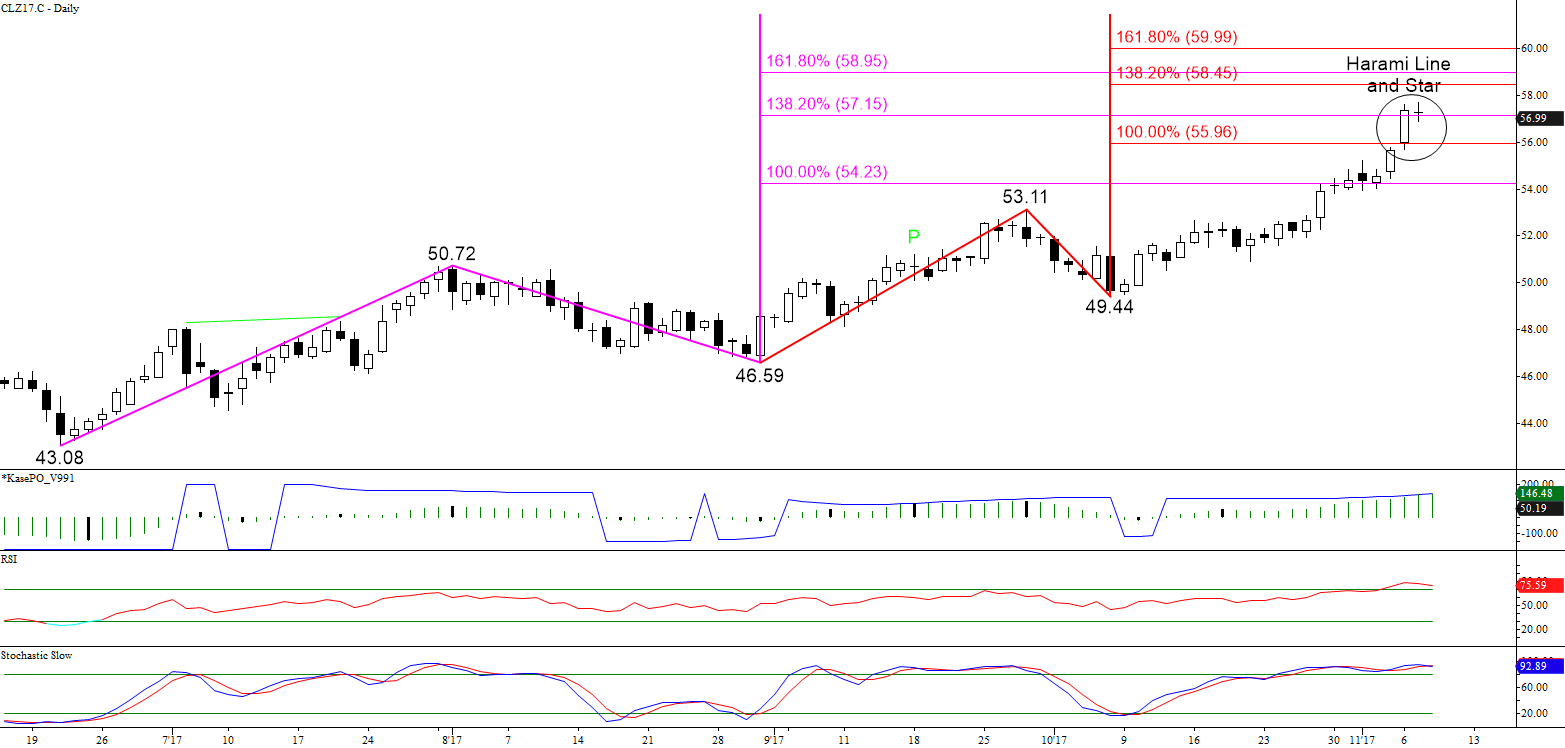
The late move below the $56.89 swing low opens the way for at least $56.6. This is the Harami line and star’s completion point and equal to (1.00) target of the wave $57.69 – 56.89 – 57.44. A move below this would call for $56.1, the star’s confirmation point and the larger than (1.618) target of the wave down from $57.69. For now, $56.1 will probably hold, but settling below this would shift odds in favor of a larger downward correction to $55.2 and possibly $54.7 before the move up continues toward $60.0.

For today’s small move down to continue the $57.44 swing high must hold. A move above this would take out the wave down from $57.69 that projects to $56.6 and lower. This would also call for a test of $58.1. A close above $58.1 would put near-term odds back in favor of $58.5 and $59.0. Both are important projections for the waves up from $46.59 and $43.08, respectively.

This is a brief analysis for the next day or so. Our weekly Crude Oil Commentary and daily updates are much more detailed and thorough energy price forecasts that cover WTI, Brent, RBOB Gasoline, Diesel, and spreads. If you are interested in learning more, please sign up for a complimentary four-week trial.

December WTI crude oil had a legitimate chance for the corrective move down from $54.46 to extend today after setting up a daily evening star and intraday head and shoulders formation. However, support held, and prices rose at the end of the day, settling above the key $54.2 target and opening the way for $55.0 and higher tomorrow.

The next major confluence point is $56.0, the equal to (1.00) target of the wave $46.59 – 53.11 – 49.44, and the larger than (1.618) target of the wave $49.44 – 52.65 – 50.87. Small pullbacks will likely take place before $56.0 is met. Once this objective is overcome look for $56.4 and likely $57.2, the intermediate (1.382) target of the wave $43.08 – 50.72 – 46.59.

WTI Crude Oil
WTI Crude Oil

Resistance at $54.2 has now become support that will likely hold tomorrow. A move below this would call for $53.8 and possibly $53.4, last Friday’s midpoint. Settling below $53.4 is unlikely over the next few days but would indicate a larger correction is underway before the move up continues to $56.0 and possibly higher.

This is a brief analysis for the next day or so. Our weekly Crude Oil Commentary and daily updates are much more detailed and thorough energy price forecasts that cover WTI, Brent, RBOB Gasoline, Diesel, and spreads. If you are interested in learning more, please sign up for a complimentary four-week trial.

WTI crude oil met support at $51.3 before stalling at $51.21. The move down has been choppy and forms a bullish wedge on the $0.35 Kase Bar chart. The move up from $51.21 was aggressive and is poised to break higher out of the wedge and challenge key resistance at $52.5 again tomorrow. A close above this would open the way for $53.0, $53.5, and ultimately $54.2, the next major objective.

WTI Crude Oil $0.35 Kase Bars

That said, prices pulled back a bit this afternoon, therefore a test of $51.4 might take place first, but support is expected to hold. A move below $51.4 before $52.5 is met would call for $51.1 and possibly $50.3. The near-term outlook becomes negative again upon a close below $50.3, the 62 percent retracement of the move up from $49.1 and the 1.618 projection of the wave $52.37 – 51.21 – 52.17.

This is a brief analysis for the next day or so. Our weekly Crude Oil Commentary and daily updates are much more detailed and thorough energy price forecasts that cover WTI, Brent, RBOB Gasoline, Diesel, and spreads. If you are interested in learning more, please sign up for a complimentary four-week trial.

Many near-term factors are positive for WTI crude oil. Tuesday’s move up confirmed a daily morning star, today’s move settled above the $51.22 swing high, and last week’s $50.5 midpoint has been overcome. These factors call for the move up to continue, but caution is warranted.

WTI met and held the exact 62 percent retracement of the decline from $58.26 to $49.1 when it rose to $51.42 today. This crucial level held again when prices rose to $51.37 ahead of the close.

WTI Crude Oil Kase Bars
WTI Crude Oil $0.35 Kase Bars

Therefore, prices will probably test support at $50.6 before challenging $51.4 again. Key support is $50.1, Tuesday’s midpoint and the 62 percent retracement of the rise from $49.1 to $51.42. A close below this would indicate the move up has failed and that the near-term has readopted a negative outlook.

Should prices settle above $51.4, look for a $52.1 and more likely $52.5 to be met before the end of the week.

This is a brief analysis for the next day or so. Our weekly Crude Oil Commentary and daily updates are much more detailed and thorough energy price forecasts that cover WTI, Brent, RBOB Gasoline, Diesel, and spreads. If you are interested in learning more, please sign up for a complimentary four-week trial.

November WTI crude oil met the 62 percent retracement of November’s decline from the 2017 $58.37 swing high to $42.8 at $52.42 when it rose to $52.43 early this morning. This is major resistance because it is also a confluent wave projection. Settling above $52.6, the upper end of the confluence range around $52.42, would be bullish for the long-term.

Crude Oil Daily Candlesticks

For now, the long-term outlook remains positive. However, normally, when such an important target is met a significant correction will take place before that objective is overcome on a sustained closing basis. Today’s pullback from $52.42 formed a bearish Harami line and star, which is a reversal pattern. These patterns are not highly reliable, but the overbought daily Stochastic, RSI and nearly overbought KasePO indicate a pullback should take place soon.

This afternoon’s move up after the API Petroleum Inventories report was released indicates $52.6 might be tested early tomorrow. However, we expect this level to hold and for the downward correction to extend to at least $51.4 tomorrow, which is in line with Monday’s $51.45 midpoint. A close below this would open the way for $51.0 and possibly lower.

At this point, even a normal correction of the move up from the $46.14 swing low could drop prices to $50.0 should the corrective pullback extend as expected.

This is a brief analysis for the next day or so. Our weekly Crude Oil Commentary and daily updates are much more detailed and thorough energy price forecasts that cover WTI, Brent, RBOB Gasoline, Diesel, and spreads. If you are interested in learning more, please sign up for a complimentary four-week trial.

WTI crude oil has formed strong resistance between $50.82 and $50.88. This level has been challenged three times over the past few days and held. One might argue that this is a triple top. However, the decline from $50.88 has been extremely shallow and choppy indicating it is most likely corrective.

This afternoon’s move up from the $49.73 swing low calls for another attempt at $50.9 early tomorrow. A move above this would call for $51.3, a confluent wave projection that sits just above the 200-day moving average. The confluence and importance of $51.3 make it another potential stalling point. A close over $51.3 would call for $51.7 and $52.5.

Crude Oil Daily Wave Projections

That said, the daily Stochastic is overbought and the move up seems to be exhausted. Should prices fall below $49.6 before rising above $50.9, look for an extended correction to $48.9 and possibly lower before the move up continues to $51.3.

This is a brief analysis for the next day or so. Our weekly Crude Oil Commentary and daily updates are much more detailed and thorough energy price forecasts that cover WTI, Brent, RBOB Gasoline, Diesel, and spreads. If you are interested in learning more, please sign up for a complimentary four-week trial.

WTI crude oil still looks weaker than Brent and products after forming a star today and settling below Friday’s $48.28 midpoint. However, prices are poised to break higher out of a bullish ascending triangle and should meet the smaller than (0.618) target of the wave $47.0 – 48.44 – 47.84 at $48.7. A close above this would clear the way for the equal to (1.00) target at $49.3. This is an important objective because it is also in line with the smaller than target of the wave $45.58 – 49.42 – 47.0.

October 2017 WTI Crude Oil Kase Bar Chart

There is an outside chance the formation that makes up the ascending wedge is alternatively a double top at $48.44. To confirm the pattern prices would have to hold $48.44 and settle below the $47.84 swing low. This would then call for a test of the double top’s $47.2 target. Settling below $47.2 would call for the decline to extend to $46.8 and $46.4. The $46.4 level is most important because it is the smaller than target of the larger scale wave $50.51 – 45.58 – 49.42.

This is a brief analysis for the next day or so. Our weekly Crude Oil Commentary and daily updates are much more detailed and thorough energy price forecasts that cover WTI, Brent, RBOB Gasoline, Diesel, and spreads. If you are interested in learning more, please sign up for a complimentary four-week trial.

October WTI crude oil could not settle above $49.2 resistance and is exhibiting signs of exhaustion. A pullback should take place soon, but at this point, there are no definitive technical factors that indicate the move up will stall before reaching $49.6 and possibly $50.0. A close over $50.0 would open the way for another test of $50.5, which then connects to $51.1 and higher.

Crude Oil Daily Candlesticks

Initial support is $48.6. A close below this would call for a larger downward correction to $48.0 and $47.4. Support at $48.0 is the 100-day moving average and the 38 percent retracement of the move up from $45.58. A normal correction should hold $48.0. Support at $47.4 is in line with the 50-day moving average and the 62 percent retracement of the move up from $45.58. Settling below $47.4 would be a strong indication the move up is over.

This is a brief analysis for the next day or so. Our weekly Crude Oil Commentary and daily updates are much more detailed and thorough energy price forecasts that cover WTI, Brent, RBOB Gasoline, Diesel, and spreads. If you are interested in learning more, please sign up for a complimentary four-week trial.

October WTI crude oil continues to work its way toward crucial support at $45.6. Most importantly, this is the 62 percent retracement of the move up from $42.52 to $50.51. It is also a confluent projection for the waves down from $48.91, $48.5, and $48.2. A move below initial support at $46.1 will clear the way for $45.6.

CLV17 Daily Chart
CLV17 Daily Chart

The confluence of projections at $45.6 makes it a potential stalling point. However, today’s $46.44 settle was below the $46.5 smaller than (0.618) target of the larger scale wave $50.51 – 46.62 – 48.91. Therefore, this wave should ultimately extend to its $45.0 equal to (1.00) target. An upward correction will likely take place once $45.6 is met, but while the $48.91 swing low holds, odds will favor an eventual decline to $45.0.

That said, unstable external factors have crude and products on edge. Therefore, the move up from $45.76 this afternoon was likely short covering. Resistance at $46.9 should hold tomorrow. A move above this would call for a test of Monday’s $47.2 midpoint. Even so, unless WTI settles above $47.8, which splits the difference between Monday’s open and the 62 percent retracement of the decline from $48.91, the near-term outlook will remain negative.

This is a brief analysis for the next day or so. Our weekly Crude Oil Commentary and daily updates are much more detailed and thorough energy price forecasts that cover WTI, Brent, RBOB Gasoline, Diesel, and spreads. If you are interested in learning more, please sign up for a complimentary four-week trial.

WTI crude oil fell sharply last Thursday after OPEC and other major producers announced an extension to production cuts through March 2018. This was expected by most, and according to media, the decline was due to disappointment that production cuts were not deeper, which many had hoped for.

U.S. shale production remains a concern, though stockpiles fell for a seventh straight week, a fact that many have seemed to overlook. In addition, some are reportedly wondering what OPEC’s plan for an exit strategy to the production cuts will be without flooding the market with supply again.

For now, the extension of the OPEC cuts has become a game of “wait-and-see”. They will undoubtedly have a longer-term impact on prices, but at this point, it is hard to tell how significant the impact will be.

Most technical factors are negative, though it is still a tight call. July WTI made up some ground since falling late last week. However, the formation of a head and shoulders pattern is negative for the near-term outlook. The pattern’s neckline is $48.1, a close below which would open the way for the move down to continue toward its $44.65 target.

July 2017 WTI Crude Oil - 35-Cent Kase Bar Chart
July 2017 WTI Crude Oil – 35-Cent Kase Bar Chart

The connection to $48.1 is made through $49.1 and $48.6, the 0.618 and 1.00 projections of the wave $50.28 – 49.03 – 49.83. Tomorrow, we expect prices to test $49.1 and $48.6. A close below the lower objective would call for $48.1, the 1.382 projection, which is also near the 0.618 projection of the larger wave, $52.0 – 48.18 – 50.28.

That said, should prices rise above $50.3, near-term odds would shift in favor of $51.1 and possibly higher. The $50.3 level is the top of the head and shoulder’s right shoulder and the 0.618 projection of the wave $48.18 – 50.28 – 49.03. The 1.00 projection is $51.1. Therefore, a close above $50.3 would significantly damage the head and shoulders formation and the likelihood of a break below its $48.1 neckline.

This is a brief analysis and outlook for the next day or so. Our weekly Crude Oil Commentary and daily updates are much more detailed and thorough energy price forecasts that cover WTI, Brent, RBOB Gasoline, Diesel, and spreads. If you are interested in learning more, please sign up for a complimentary four-week trial.