Natural Gas Price Forecast – October 28, 2020

Natural Gas Technical Analysis and Near-Term Outlook

The near-term outlook for natural gas leans bullish. However, this is still a tight call because the $3.37/$3.362 double top is still intact and this week’s move up stalled near the equal to (1.00) target of the wave up from $3.159. Also, today’s Harami candlestick is negative and the wave down from $3.336 met its smaller than (0.618) target this afternoon. Therefore, a test of $3.25 and possibly $3.22 is expected before overcoming $3.33. This implies that trading will most likely remain range-bound for another few days before the move up continues.

Natural Gas - $0.035 Kase Bar Chart
Natural Gas – $0.035 Kase Bar Chart

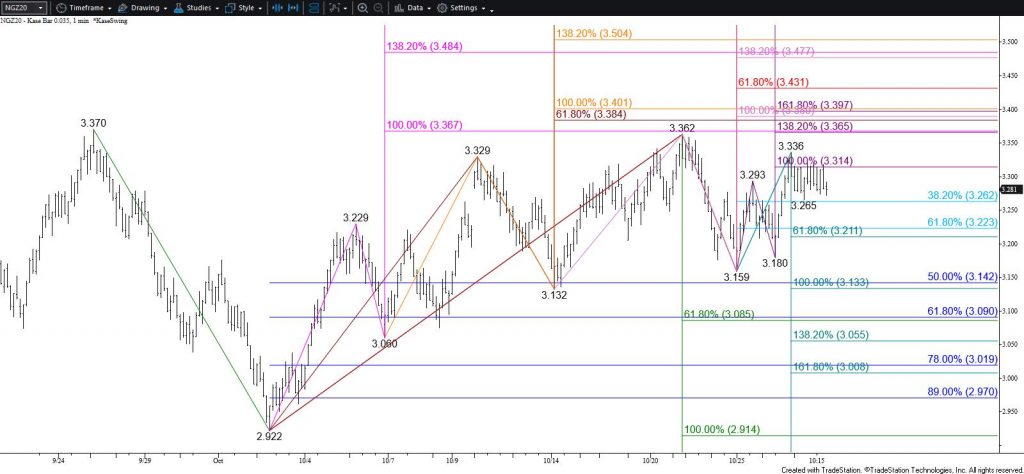
Closing above $3.33 will call for a test of key resistance at $3.37. This is the most confluent target on the chart, a close above which will negate the double top and clear the way for $3.43 and higher.

For natural gas to overcome $3.37 during the next few days, support at $3.22 must hold. Closing below this will take out the smaller than target of the wave down from $3.362, which would call for a test of the $3.13 equal to target. This level is crucial for the near-term because a close below $3.13 will call for $3.09. This is the 62 percent retracement of the rise from $2.922 and the smaller than target of the wave down from $3.37. Settling below $3.09 would clear the way for a test of $3.01 and possibly lower.

This is a brief analysis for the next day or so. Our weekly Natural Gas Commentary and daily updates are much more detailed and thorough energy price forecasts that cover key natural gas futures contracts, calendar spreads, the UNG ETF, and several electricity contracts. If you are interested in learning more, please sign up for a complimentary four-week trial.

Natural Gas Technical Analysis and Near-Term Outlook

Natural gas overcame $2.96 as called for and challenged the next objective at $3.04. Today’s close well above $2.96 and the psychologically important $3.00 level is bullish for the outlook. This calls for natural gas to challenge at least $3.09 and likely $3.14 during the next few days. The $3.14 objective is a crucial objective for the primary wave up from $2.072. However, $2.96 was in line with the smaller than (0.618) target of the primary wave up from $3.373, and this wave targets $3.20 as its equal to target. Therefore, odds for an eventual move above $3.14 to $3.20 and higher have increased based on the close above $2.96.

Natural Gas - $0.035 Kase Bar Chart
Natural Gas – $0.035 Kase Bar Chart

With that said, the $3.04 target discussed in yesterday’s update is a confluent projection of the subwaves up from $2.373 and $2.610. Also, the move up from 2.638 lacks a clear wave structure that is large enough to support a continued rise. Therefore, a test of support will probably take place soon, and almost certainly before natural gas overcomes $3.14.

Nevertheless, any move down will be corrective of the move up. Should natural gas turn lower early tomorrow look for initial support at $2.96 and key near-term support at $2.90. Settling below $2.90 is doubtful but would clear the way for a more substantial test of support before the move up ultimately continues.

This is a brief analysis for the next day or so. Our weekly Natural Gas Commentary and daily updates are much more detailed and thorough energy price forecasts that cover key natural gas futures contracts, calendar spreads, the UNG ETF, and several electricity contracts. If you are interested in learning more, please sign up for a complimentary four-week trial.

Natural Gas Technical Analysis and Near-Term Outlook

Natural gas is settling into a trading range as expected. Near-term technical factors are well balanced, and the narrowing range is forming a coil pattern. In this case, the coil is taking shape after a decline, so odds would normally favor a break lower out of the pattern. However, coils are not the most reliable patterns in regard to predicting a directional breakout. Coils reflect uncertainty, which is currently the case for natural gas as it sorts through conflicting short-term bullish and bearish external factors (weather forecasts, hurricane shut-ins/demand destruction, LNG demand, falling production, etc.).

This afternoon’s move is a good example of the recent indecisiveness. After rising to challenge the smaller than (0.618) target of the wave up from $2.373 at the $2.686 swing high, prices fell to test the smaller than target of the wave down from $2.727 at the $2.540 swing low. This was also the 62 percent retracement of the rise from $2.466. The subsequent move up to $2.633 stalled at the 62 percent retracement of the decline from $2.686.

Natural Gas - $0.03 Kase Bar Chart
Natural Gas – $0.03 Kase Bar Chart

With that said, natural gas will likely remain range-bound for another day or two. During that time, the waves that form should help determine the direction of the pending coil breakout.

For now, based on this afternoon’s decline from $2.633, odds lean in favor of testing coil’s lower trendline around $2.54 early tomorrow. This level will probably hold, at least initially. Nevertheless, a close below $2.54 will call for $2.46, which then connects to key lower support at $2.40.

Conversely, should natural gas fail to reach $2.54 before overcoming $2.67 a short-fall within the coil will form. This is a bullish signal that triggers when prices within a pattern like a coil fail to test a trendline, in this case, the lower trendline around $2.54. Settling above $2.67 will call for key resistance at $2.76, which then connects to $2.83 and higher.

This is a brief analysis for the next day or so. Our weekly Natural Gas Commentary and daily updates are much more detailed and thorough energy price forecasts that cover key natural gas futures contracts, calendar spreads, the UNG ETF, and several electricity contracts. If you are interested in learning more, please sign up for a complimentary four-week trial.

Natural Gas Technical Analysis and Near-Term Outlook

Natural gas held major support at $2.43 and today’s move up implies that a larger test of resistance should take place tomorrow. The move up is still considered to be corrective of the recent decline and must settle above $2.67 to state that the move down might be complete. Natural gas will have to settle above $2.78 to reestablish a firm bullish outlook. Such a move is doubtful without a significant boost from external factors.

Near-term odds favor at least $2.60 and likely $2.67. These are the smaller than (0.618) and equal to (1.00) targets of the primary wave up from $2.425. The $2.67 objective is also near the 38 percent retracement of the decline from $3.002 and is Tuesday’s midpoint. Settling above this would suggest that the move down is complete. However, as stated above, November natural gas will have to settle above $2.78 to confirm a bullish outlook.

Natural Gas - $0.03 Kase Bar Chart
Natural Gas – $0.03 Kase Bar Chart

With that said, the overarching bias remains bearish due to Tuesday’s decline and the large seasonal rollover gap on the continuation chart. Even so, $2.43 is major support that could form a bullish base because it is the equal to target of the wave down from $3.002, the 62 percent retracement of the rise from $2.072, and the 200-day moving average. Therefore, while $2.43 holds, near-term odds will continue to favor a larger test of resistance.

Should natural gas take out $2.48 early tomorrow look for another test of $2.43. Settling below this will call for a much more significant move down before stalling again.

This is a brief analysis for the next day or so. Our weekly Natural Gas Commentary and daily updates are much more detailed and thorough energy price forecasts that cover key natural gas futures contracts, calendar spreads, the UNG ETF, and several electricity contracts. If you are interested in learning more, please sign up for a complimentary four-week trial.

Natural Gas Technical Analysis and Near-Term Outlook

October natural gas finally rallied after holding support around $1.82. The prompt month’s move up should be bolstered by rising winter prices and a bullish shift in near-term external factors.

October settled below $2.16, the 38 percent retracement of the decline from $2.743 and the XC (2.764) projection. This objective was also in line with October’s 100- and 200-day moving averages. Nevertheless, the post-settlement rise to $2.207 implies that near-term sentiment remains bullish headed into tomorrow.

Natural Gas - $0.03 Kase Bar Chart
Natural Gas – $0.03 Kase Bar Chart

The next major objectives for October natural gas are $2.27 and $2.38. The $2.27 target is the 50 percent retracement from $2.743 and 50-day moving average. The $2.38 target is the 62 percent retracement. Settling above $2.38 will call for $2.44, the smaller than (0.618) target of the wave up from $1.70 that connects to $2.84 and higher.

The challenge for tomorrow is that the wave formation up from $1.795 does not project any higher than $2.22. This is the trend terminus for that wave and the move up from $1.808 lacks a clear wave structure. Therefore, there is a good chance for a test of support before prices rise much higher.

There is immediate support at $2.11 but given the increase in volatility, a test of $2.05 is probable. Key support is $1.99. This is the 50 percent retracement of the rise from $1.795 and today’s midpoint. Closing below $1.99 would call for $1.95 and $1.84, the latter of which is the barrier to an unlikely bearish outlook in the coming weeks.

This is a brief analysis for the next day or so. Our weekly Natural Gas Commentary and daily updates are much more detailed and thorough energy price forecasts that cover key natural gas futures contracts, calendar spreads, the UNG ETF, and several electricity contracts. If you are interested in learning more, please sign up for a complimentary four-week trial.

Natural Gas Technical Analysis and Near-Term Outlook

The near-term outlook for natural gas has shifted back to being firmly bearish. Yesterday’s move up proved to be another pullback to challenge the neckline of the complex head and shoulders. Also, natural gas settled below the crucial $2.28 objective and fell toward another important target at $2.22 after the settlement.

The $2.22 target is the 50 percent retracement of the rise from $1.700 and a confluent wave projection. There is also a target at $2.19 that has increased in importance during the past few days. This area between $2.19 and $2.22 may prove to be a stalling point. Even so, any move up from this area will most likely prove to be a short-lived correction and is expected to hold $2.31.

Natural Gas - $0.035 Kase Bar Chart
Natural Gas – $0.035 Kase Bar Chart

Now that natural gas has taken out the $2.28 equal to (1.00) target the primary wave down from $2.743, the decline is poised to extend to the $2.15 intermediate (1.382) target and then the $2.10 larger than (1.618) target. The $2.10 target is crucial and is the most likely stalling point for the decline from $2.743 because this is also the 62 percent retracement of the move up from $1.700 and the complex head and shoulders’ target.

The 50-day moving average held on a closing basis today, but prices have already moved below that level after the settlement. Otherwise, there are no signals or patterns that call for the move down to end. As stated earlier, resistance at $2.31 is expected to hold and $2.35 is key for the near-term. Settling above $2.35 will call for another attempt at $2.43 and higher.

This is a brief analysis for the next day or so. Our weekly Natural Gas Commentary and daily updates are much more detailed and thorough energy price forecasts that cover key natural gas futures contracts, calendar spreads, the UNG ETF, and several electricity contracts. If you are interested in learning more, please sign up for a complimentary four-week trial.

Natural Gas Near-Term Technical Analysis and Outlook

The near-term outlook for natural gas remains bearish after challenging support at $2.34 when prices fell to $2.328 today. This is a relatively important area of support because it is the intermediate (1.382) target of the first wave down from $2.743 and the 38 percent retracement of the rise from $1.700. Even so, the subsequent move up from $2.328 forms a bearish pennant that should break lower tomorrow.

Natural Gas - Complex Head and Shoulders on $0.035 Kase Bar Chart
Natural Gas – Complex Head and Shoulders on $0.035 Kase Bar Chart

Closing below $2.33 (adjusted from $2.34) will clear the way for $2.28. This is another potential stalling point because it is the larger than (1.618) target of the first wave down from $2.743 and the equal to (1.00) target of the primary wave down from $2.743. As discussed in yesterday’s update, settling below $2.28 might initially be a challenge, but odds for this are increasing.

The one caveat headed into tomorrow is that natural gas has not settled below the $2.40 neckline of the complex head and shoulders pattern. Prices settled at exactly $2.40 yesterday and $2.406 today. This is not too concerning but is something to watch during the next few days. Should natural gas rise above $2.45, look for a test of $2.50. This level is expected to hold. Key resistance and the barrier to a bullish near-term outlook is $2.60.

This is a brief analysis for the next day or so. Our weekly Natural Gas Commentary and daily updates are much more detailed and thorough energy price forecasts that cover key natural gas futures contracts, calendar spreads, the UNG ETF, and several electricity contracts. If you are interested in learning more, please sign up for a complimentary four-week trial.

Natural Gas Near-Term Outlook

Natural gas confirmed an intra-day head and shoulders reversal pattern by settling below $2.50 today. The pattern’s target is $2.26, which is also in line with the larger than (1.618) target of the primary wave down from $2.743. The connection to $2.26 is made through $2.42 and $2.34. The $2.34 objective is crucial because this is the most confluent target on the chart and is the 38 percent retracement of the rise from $1.700.

Natural Gas - Head and Shoulders on $0.025 Kase Bar Chart
Natural Gas – Head and Shoulders on $0.025 Kase Bar Chart

For the five-wave move up from $1.700 to have any chance at extending again and reaching its $2.81 objective $2.34 must hold. At this point, holding $2.34 for more than a day or two is doubtful. It now looks as though the five-wave trend has ended and that a large three-wave correction is underway. Settling below $2.34 will confirm this.

The move down has been somewhat choppy for the past few days. This suggests the decline is corrective. Even so, resistance at $2.57 is expected to hold as the move down extends. Key near-term resistance is $2.63. This is the 62 percent retracement of the decline from $2.743, a close above which would call for a test of $2.68 and then $2.73. Settling above $2.73 would clear the way for a push to challenge $2.81.

This is a brief analysis for the next day or so. Our weekly Natural Gas Commentary and daily updates are much more detailed and thorough energy price forecasts that cover key natural gas futures contracts, calendar spreads, the UNG ETF, and several electricity contracts. If you are interested in learning more, please sign up for a complimentary four-week trial.

Natural Gas Near-Term Outlook

Tomorrow’s outlook for October natural gas leans negative after confirming an intra-day double top that formed between the $2.658 and $2.654 swing highs. The double top was confirmed by today’s close below the $2.564 swing low and the pattern’s target is $2.47. Double tops like this one meet their target 64 percent of the time.

Natural Gas - Double Top on $0.015 Kase Bar Chart
Natural Gas – Double Top on $0.015 Kase Bar Chart

The decline will not likely last much longer because the move down from $2.658 forms a corrective wave in a larger scale five-wave uptrend. There is also immediate support at $2.50 that may prove to be a stalling point early tomorrow. This is in line with the larger than (1.618) target of the primary wave down from $2.658 and the 62 percent retracement of the rise from $2.424. Therefore, closing below $2.47 is doubtful. However, this would clear the way for a larger correction to challenge $2.39 and possibly lower.

Once the $2.47 target is met odds for a continued rise will increase. However, should $2.50 hold, look for initial resistance at $2.57, and then $2.61. Settling above $2.61 would strongly imply that the correction is complete and clear the way for $2.67 and higher.

This is a brief analysis for the next day or so. Our weekly Natural Gas Commentary and daily updates are much more detailed and thorough energy price forecasts that cover key natural gas futures contracts, calendar spreads, the UNG ETF, and several electricity contracts. If you are interested in learning more, please sign up for a complimentary four-week trial.

Natural Gas Near-Term Outlook

The outlook for natural gas remains bullish because September’s move up from $1.583 is unfolding as a textbook five-wave trend the targets $2.75. The more recent rise from $2.085 forms a likely Wave 1/V that has broken down into five sub-waves that stalled at $2.465 yesterday. The decline from $2.465 is corrective and probably forms Wave 2/V. Settling above $2.48 will indicate that Wave 3/V is underway and would call for $2.55 and higher.

Natural Gas – Five-Wave Trend on a $0.03 Kase Bar Chart

Nevertheless, today’s hanging man and a confirmed daily bearish MACD divergence indicate a deeper test of support might take place first. Falling below $2.39 early tomorrow will call for $2.32. This level is expected to hold because it is the 38 percent retracement of the rise from $2.085. Settling below $2.32 will all for Wave 2/V to challenge $2.28 and possibly $2.23. For the five-wave trend to continue to unfold as expected $2.23 must hold.

This is a brief analysis for the next day or so. Our weekly Natural Gas Commentary and daily updates are much more detailed and thorough energy price forecasts that cover key natural gas futures contracts, calendar spreads, the UNG ETF, and several electricity contracts. If you are interested in learning more, please sign up for a complimentary four-week trial.